Discover today’s performance of BLOM indices, the closing prices of Lebanese stocks and Eurobonds, as well as the exchange rate of major currencies against the LBP.
BLOM Stock Index (BSI) – today’s performance
| Last | Previous | % Change | Y-t-D Change | |
| BSI | 855.48 | 857.59 | -0.25% | -12.42% |
| High | 858.20 | 857.59 | ||
| Low | 853.40 | 855.30 | ` | |
| Volume | 11,905 | 25,329 | ||
| Val ($) | 290,481 | 134,748 |
I): BLOM preferred Shares Index (BPSI): today’s Performance
| Last | Previous | Change | |
| BPSI | 82.92 | 83.06 | -0.17% |
| Volume | 3,503 | ||
| Value | 240,767 |
Lebanese Stocks: today’s Trades and Closing Prices
| Last Price ($) | % Change | Volume | VWAP ($) | |
| Solidere A | 6.28 | -2.03% | 3,841 | 6.28 |
| Solidere B | 6.34 | -1.25% | 3,561 | 6.34 |
| Byblos Bank Pref 2008 | 69 | 3.29% | 1,000 | 69.00 |
| Byblos Bank Pref 2009 | 68.6 | -4.72% | 2,503 | 68.62 |
| CB (N) | 3 | 0.00% | 1,000 | 3.00 |
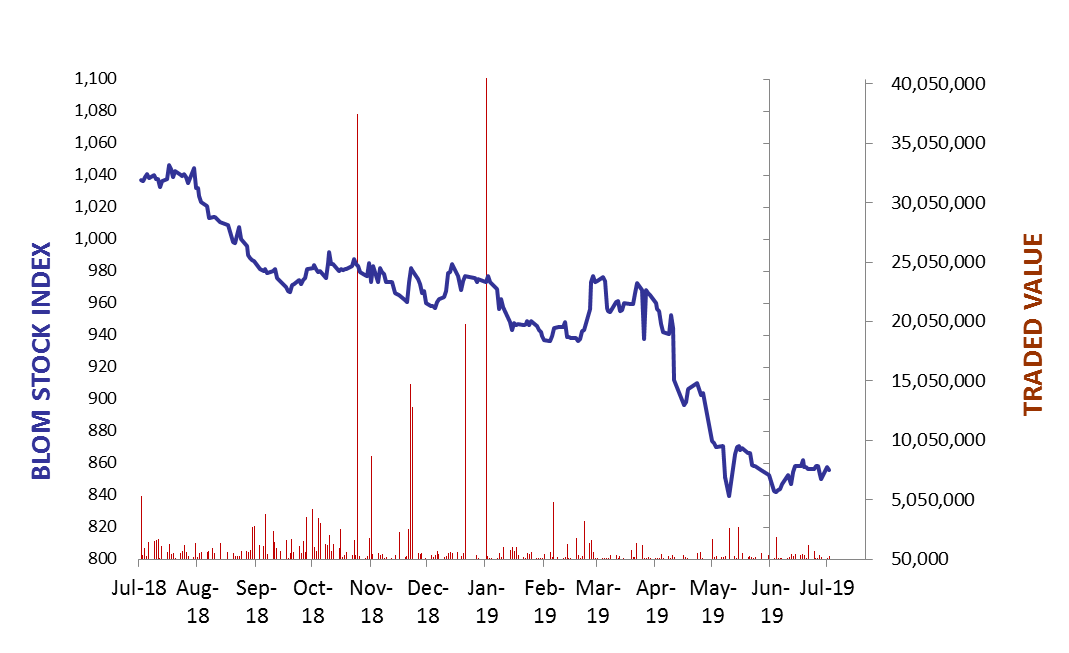
The BLOM Stock Index
Lebanese Global Depository Receipts: Last session’s Performance
| GDRs | Last Price ($) | Previous Price ($) | % Change | Volume | Value ($) |
| BLOM GDR | 7.4 | 7.5 | -1.33% | 12,688 | 93,891 |
| Audi GDR | 3.96 | 3.96 | 0.00% | – | – |
| Byblos GDR | 77 | 77 | 0.00% | – | – |
Closing Date: 08 July 2019
Source: London Stock Exchange
BLOM BOND INDEX: Last Session’s Performance
| Last | Previous | Change | Y-t-D Change | ||
| BBI | 90.80 | 91.16 | -0.39% | -10.15% | |
| Weighted Yield | 10.67% | 10.57% | 9 | bps | |
| Duration (Years) | 5.15 | 5.16 | |||
| 5Y Bond Yield | 11.10% | 11.08% | 2 | bps | |
| 5Y Spread* | 926 | 926 | 0 | bps | |
| 10Y Bond Yield | 10.50% | 10.40% | 10 | bps | |
| 10Y Spread* | 856 | 847 | 9 | bps | |
*between Lebanese Eurobonds and US Treasuries
Closing Date: 08 July 2019
Lebanese Eurobonds: Last Sessions’ Prices and Yields
| Price | Yield | Yield Change | |
| 12/04/2021 | 94.88 | 11.53% | 20 |
| 04/10/2022 | 86.83 | 11.04% | 5 |
| 27/01/2023 | 85.25 | 11.14% | 6 |
| 22/04/2024 | 83.29 | 11.25% | 7 |
| 04/11/2024 | 81.08 | 11.04% | 8 |
| 03/12/2024 | 83.18 | 11.23% | 14 |
| 26/02/2025 | 80.88 | 10.82% | 7 |
| 12/06/2025 | 81.42 | 10.54% | 9 |
| 28/11/2026 | 80.04 | 10.55% | 12 |
| 23/03/2027 | 80.42 | 10.63% | 13 |
| 29/11/2027 | 79.42 | 10.50% | 11 |
| 03/11/2028 | 79.71 | 10.05% | 6 |
| 26/02/2030 | 78.46 | 9.98% | 5 |
| 22/04/2031 | 78.21 | 10.22% | 4 |
| 23/03/2032 | 79.28 | 9.90% | 8 |
| 02/11/2035 | 77.34 | 9.87% | 5 |
| 23/03/2037 | 78.42 | 9.86% | 4 |
Lebanese Forex Market
| Last Price | Previous | % Change | Y-t-D | |
| $/LBP | 1,514.25 | 1,514.25 | – | |
| €/LBP | 1,689.30 | 1,690.51 | -0.07% | |
| £/LBP | 1,878.65 | 1,885.88 | -0.38% | |
| NEER | 118.53 | 118.52 | 0.01% |
Closing Date: 09 July 2019