Discover today’s performance of BLOM indices, the closing prices of Lebanese stocks and Eurobonds, as well as the exchange rate of major currencies against the LBP.
BLOM Stock Index (BSI) – today’s performance
| Last | Previous | % Change | Y-t-D Change | |
| BSI | 809.07 | 809.55 | -0.06% | -17.17% |
| High | 811.50 | 811.50 | ||
| Low | 808.70 | 808.70 | ` | |
| Volume | 43,300 | 77,740 | ||
| Val ($) | 102,528 | 189,911 | ||
I): BLOM preferred Shares Index (BPSI): today’s Performance
| Last | Previous | Change | |
| BPSI | 82.55 | 82.55 | 0.00% |
| Volume | |||
| Value |
Lebanese Stocks: today’s Trades and Closing Prices
| Last Price ($) | % Change | Volume | VWAP ($) | |
| Solidere A | 6.04 | 0.50% | 1,789 | 6.04 |
| Solidere B | 6.01 | -1.15% | 2,258 | 6.01 |
| Byblos Bank – Listed Shares | 1.14 | -0.87% | 32,128 | 1.14 |
| BLOM GDR | 7.2 | 0.00% | 5,000 | 7.20 |
| CB (N) | 2.6 | -5.45% | 2,125 | 2.60 |
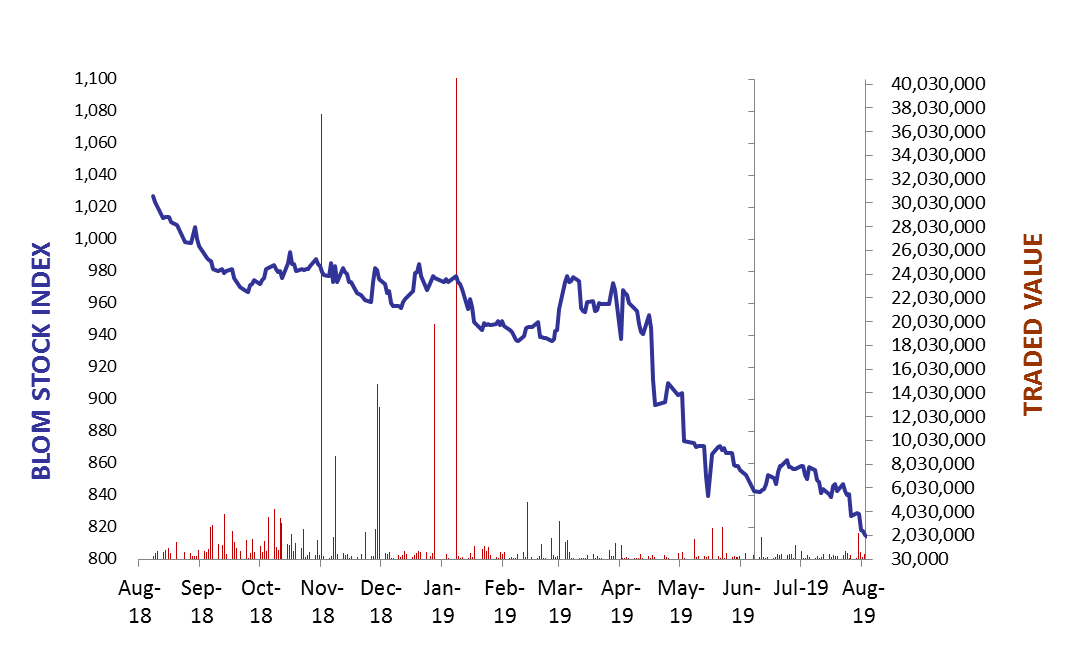
The BLOM Stock Index
Lebanese Global Depository Receipts: Last session’s Performance
| GDRs | Last Price ($) | Previous Price ($) | % Change | Volume | Value ($) |
| BLOM GDR | 7.20 | 7.2 | 0.00% | 1,875 | 13,500 |
| Audi GDR | 3.86 | 3.86 | 0.00% | – | |
| Byblos GDR | 77 | 77 | 0.00% | – | – |
Closing Date: 07 Aug. 2019
Source: London Stock Exchange
BLOM BOND INDEX: Last Session’s Performance
| Last | Previous | Change | Y-t-D Change | ||
| BBI | 84.61 | 84.25 | 0.43% | -16.28% | |
| Weighted Yield | 12.26% | 12.34% | -8 | bps | |
| Duration (Years) | 4.99 | 4.98 | |||
| 5Y Bond Yield | 12.23% | 13.32% | -109 | bps | |
| 5Y Spread* | 1072 | 1178 | -106 | bps | |
| 10Y Bond Yield | 11.74% | 11.80% | -6 | bps | |
| 10Y Spread* | 1014 | 1018 | -4 | bps | |
*between Lebanese Eurobonds and US Treasuries
Closing Date: 08 Aug 2019
Lebanese Eurobonds: Last Sessions’ Prices and Yields
| Price | Yield | Yield Change | |
| 12/04/2021 | 91.00 | 14.45% | 1 |
| 04/10/2022 | 82.04 | 13.23% | -5 |
| 27/01/2023 | 80.29 | 13.26% | -10 |
| 22/04/2024 | 78.43 | 12.90% | -7 |
| 04/11/2024 | 75.58 | 12.78% | -5 |
| 03/12/2024 | 78.51 | 12.67% | -2 |
| 26/02/2025 | 76.23 | 12.22% | -11 |
| 12/06/2025 | 76.73 | 11.88% | -10 |
| 28/11/2026 | 74.94 | 11.81% | -11 |
| 23/03/2027 | 75.17 | 11.89% | -11 |
| 29/11/2027 | 73.95 | 11.74% | -5 |
| 03/11/2028 | 73.29 | 11.40% | -12 |
| 26/02/2030 | 72.33 | 11.18% | -14 |
| 22/04/2031 | 72.71 | 11.25% | -7 |
| 23/03/2032 | 74.33 | 10.76% | -11 |
| 02/11/2035 | 72.88 | 10.58% | -11 |
| 23/03/2037 | 73.00 | 10.68% | -5 |
Lebanese Forex Market
| Last Price | Previous | % Change | Y-t-D | |
| $/LBP | 1,514.25 | 1,514.25 | – | |
| €/LBP | 1,687.95 | 1,687.95 | – | |
| £/LBP | 1,830.56 | 1,833.72 | -0.17% | |
| NEER | 118.87 | 118.84 | 0.03% |
Closing Date: 08 Aug. 2019