Discover today’s performance of BLOM indices, the closing prices of Lebanese stocks and Eurobonds, as well as the exchange rate of major currencies against the LBP.
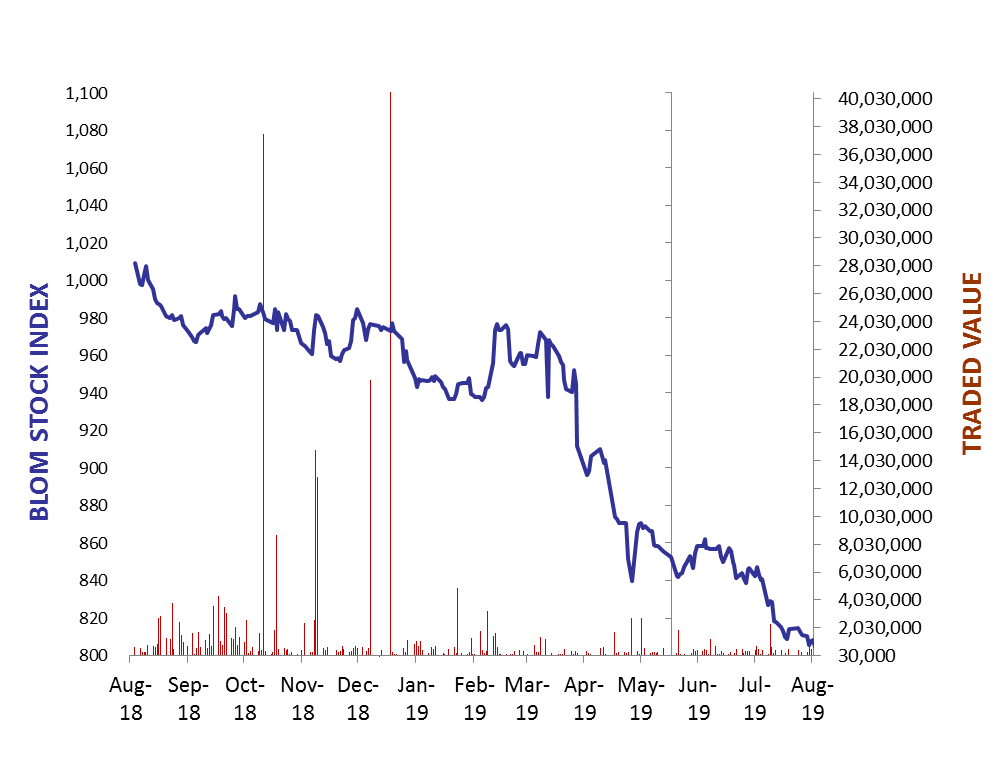
BLOM Stock Index (BSI) – today’s performance
| Last | Previous | % Change | Y-t-D Change | |
| BSI | 803.03 | 804.47 | -0.18% | -17.79% |
| High | 804.50 | 808.50 | ||
| Low | 803.00 | 804.50 | ` | |
| Volume | 55,145 | 62,344 | ||
| Val ($) | 391,582 | 388,483 |
I): BLOM preferred Shares Index (BPSI): today’s Performance
| Last | Previous | Change | |
| BPSI | 82.02 | 82.02 | 0.00% |
| Volume | – | – | |
| Value | – | – |
Lebanese Stocks: today’s Trades and Closing Prices
| Last Price ($) | % Change | Volume | VWAP ($) | |
| Solidere A | 5.96 | 0.00% | 2,809 | 5.96 |
| Solidere B | 5.86 | -2.01% | 1,319 | 5.86 |
| Bank Audi | 3.73 | -0.27% | 1,000 | 3.73 |
| BLOM – Listed Shares | 7.29 | -0.14% | 44,100 | 7.29 |
| BLOM GDR | 7.1 | 0.00% | 5,917 | 7.10 |
The BLOM Stock Index
Lebanese Global Depository Receipts: Last session’s Performance
| GDRs | Last Price ($) | Previous Price ($) | % Change | Volume | Value ($) |
| BLOM GDR | 6.95 | 7 | -0.71% | 12,230 | 85,344 |
| Audi GDR | 3.7 | 3.7 | 0.00% | 55 | 204 |
| Byblos GDR | 77 | 77 | 0.00% | – | – |
Closing Date: 23 Aug. 2019
Source: London Stock Exchange
BLOM BOND INDEX: Last Session’s Performance
| Last | Previous | Change | Y-t-D Change | ||
| BBI | 78.51 | 78.47 | 0.05% | -22.31% | |
| Weighted Yield | 14.27% | 14.26% | 1 | bps | |
| Duration (Years) | 4.84 | 4.84 | |||
| 5Y Bond Yield | 15.95% | 15.86% | 9 | bps | |
| 5Y Spread* | 1,452 | 1,433 | 19 | bps | |
| 10Y Bond Yield | 13.25% | 13.25% | 0 | bps | |
| 10Y Spread* | 1179 | 1169 | 10 | bps | |
*between Lebanese Eurobonds and US Treasuries
Closing Date: 23 Aug 2019
Lebanese Eurobonds: Last Sessions’ Prices and Yields
| Price | Yield | Yield Change | |
| 12/04/2021 | 85.88 | 18.63% | 22 |
| 04/10/2022 | 76.51 | 15.95% | -3 |
| 27/01/2023 | 74.72 | 15.83% | -2 |
| 22/04/2024 | 72.53 | 15.05% | -2 |
| 04/11/2024 | 70.16 | 14.64% | -9 |
| 03/12/2024 | 72.56 | 14.63% | 1 |
| 26/02/2025 | 70.43 | 14.10% | 2 |
| 12/06/2025 | 70.98 | 13.64% | 1 |
| 28/11/2026 | 68.81 | 13.46% | -2 |
| 23/03/2027 | 68.90 | 13.53% | -2 |
| 29/11/2027 | 68.15 | 13.19% | -2 |
| 03/11/2028 | 68.22 | 12.57% | -4 |
| 26/02/2030 | 67.47 | 12.23% | -6 |
| 22/04/2031 | 67.18 | 12.39% | 2 |
| 23/03/2032 | 67.88 | 12.01% | -3 |
| 02/11/2035 | 67.77 | 11.47% | -1 |
| 23/03/2037 | 67.81 | 11.57% | 1 |
Lebanese Forex Market
| Last Price | Previous | % Change | Y-t-D | |
| $/LBP | 1,514.25 | 1,514.25 | – | |
| €/LBP | 1,675.89 | 1,679.96 | -0.24% | |
| £/LBP | 1,845.18 | 1,850.76 | -0.30% | |
| NEER | 119.98 | 119.96 | 0.02% |
Closing Date: 26 Aug. 2019