Discover today’s performance of BLOM indices, the closing prices of Lebanese stocks and Eurobonds, as well as the exchange rate of major currencies against the LBP.
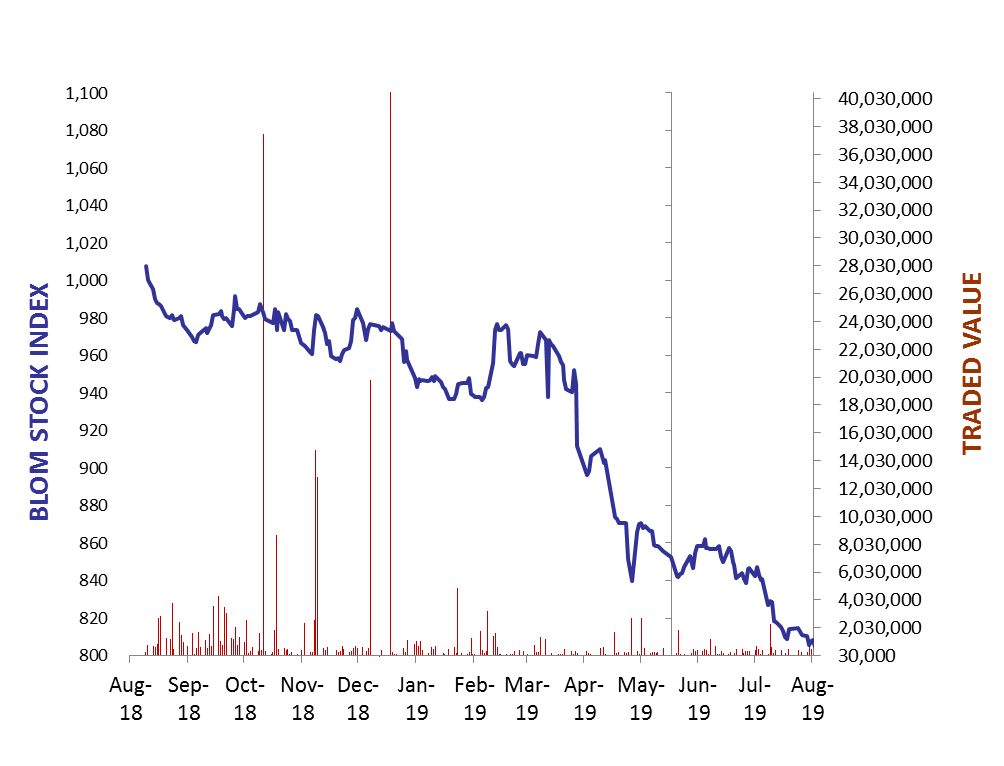
BLOM Stock Index (BSI) – today’s performance
| Last | Previous | % Change | Y-t-D Change | |
| BSI | 796.76 | 798.18 | -0.18% | -18.43% |
| High | 798.20 | 798.90 | ||
| Low | 796.50 | 797.90 | ` | |
| Volume | 45,875 | 25,286 | ||
| Val ($) | 315,968 | 198,012 |
I): BLOM preferred Shares Index (BPSI): today’s Performance
| Last | Previous | Change | |
| BPSI | 80.07 | 79.82 | 0.31% |
| Volume | 205 | 500 | |
| Value | 13,325 | 32,250 |
Lebanese Stocks: today’s Trades and Closing Prices
| Last Price ($) | % Change | Volume | VWAP ($) | |
| Solidere A | 5.7 | -1.72% | 7,088 | 5.72 |
| Solidere B | 5.8 | -0.34% | 8,872 | 5.8 |
| Byblos Bank Pref 2008 | 65 | 1.56% | 205 | 65.00 |
| BLOM GDR | 7.09 | 0.00% | 29,660 | 7.09 |
| HOLCIM | 9.66 | -2.33% | 50 | 9.66 |
The BLOM Stock Index
Lebanese Global Depository Receipts: Last session’s Performance
| GDRs | Last Price ($) | Previous Price ($) | % Change | Volume | Value ($) |
| BLOM GDR | 6.95 | 6.9 | 0.72% | 840 | 5,838 |
| Audi GDR | 3.7 | 3.7 | 0.00% | ||
| Byblos GDR | 77 | 77 | 0.00% | – | – |
Closing Date: 29 Aug. 2019
Source: London Stock Exchange
BLOM BOND INDEX: Last Session’s Performance
| Last | Previous | Change | Y-t-D Change | ||
| BBI | 76.26 | 76.51 | -0.32% | -24.54% | |
| Weighted Yield | 15.08% | 14.98% | 10 | bps | |
| Duration (Years) | 4.82 | 4.83 | |||
| 5Y Bond Yield | 16.88% | 16.83% | 5 | bps | |
| 5Y Spread* | 1,544 | 1,541 | 3 | bps | |
| 10Y Bond Yield | 13.80% | 13.70% | 10 | bps | |
| 10Y Spread* | 1234 | 1,228 | 6 | bps | |
*between Lebanese Eurobonds and US Treasuries
Closing Date: 29 Aug 2019
Lebanese Eurobonds: Last Sessions’ Prices and Yields
| Price | Yield | Yield Change | |
| 12/04/2021 | 83.88 | 16.99% | -314 |
| 04/10/2022 | 74.57 | 16.75% | -22 |
| 27/01/2023 | 72.89 | 16.00% | -63 |
| 22/04/2024 | 70.13 | 15.33% | -38 |
| 04/11/2024 | 68.29 | 15.80% | 90 |
| 03/12/2024 | 69.28 | 14.61% | -134 |
| 26/02/2025 | 68.98 | 14.18% | -33 |
| 12/06/2025 | 69.36 | 14.14% | 2 |
| 28/11/2026 | 66.47 | 14.23% | 23 |
| 23/03/2027 | 66.47 | 13.77% | -41 |
| 29/11/2027 | 66.00 | 13.04% | -63 |
| 03/11/2028 | 66.36 | 12.72% | -26 |
| 26/02/2030 | 65.38 | 12.81% | 11 |
| 22/04/2031 | 65.30 | 12.45% | -30 |
| 23/03/2032 | 65.82 | 11.88% | -59 |
| 02/11/2035 | 65.59 | 11.99% | 8 |
| 23/03/2037 | 65.59 | 12.00% | 0 |
Lebanese Forex Market
| Last Price | Previous | % Change | Y-t-D | |
| $/LBP | 1,514.25 | 1,514.25 | – | |
| €/LBP | 1,664.28 | 1,666.54 | -0.14% | |
| £/LBP | 1,835.08 | 1,837.34 | -0.12% | |
| NEER | 120.34 | 120.26 | 0.07% |
Closing Date: 30 Aug. 2019