
Discover today’s performance of BLOM indices, the closing prices of Lebanese stocks and Eurobonds, as well as the exchange rate of major currencies against the LBP.
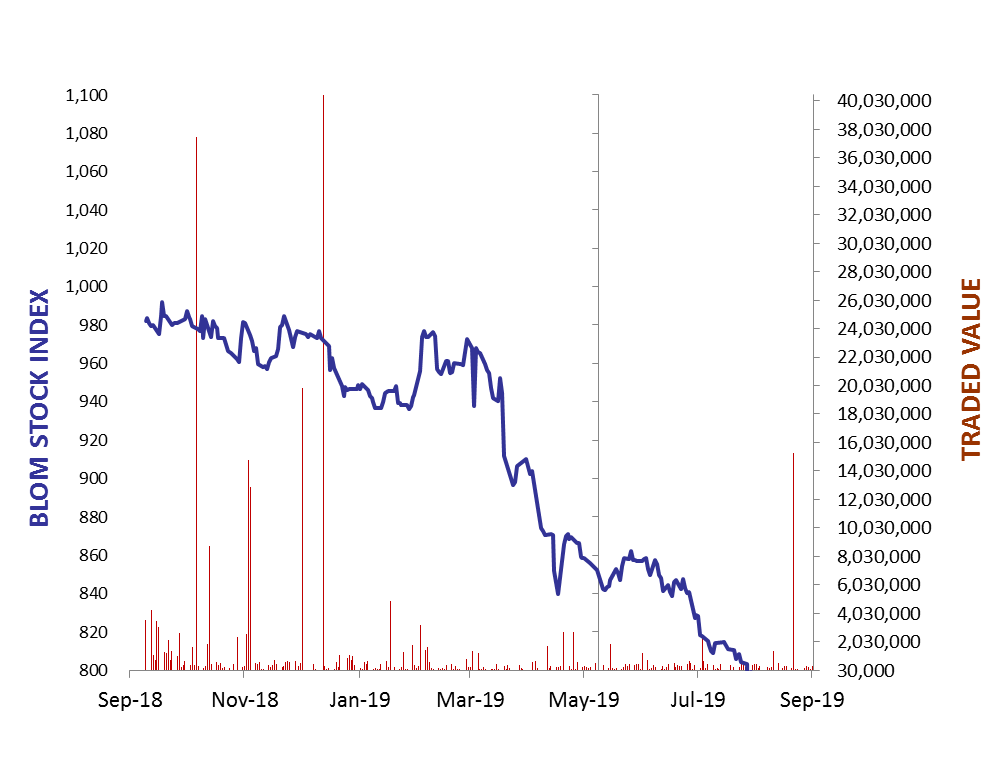
BLOM Stock Index (BSI) – today’s performance
| Last | Previous | % Change | Y-t-D Change | |
| BSI | 779.18 | 782.14 | -0.38% | -20.23% |
| High | 787.30 | 787.30 | ||
| Low | 778.50 | 779.00 | ` | |
| Volume | 44,289 | 74,581 | ||
| Val ($) | 66,494 | 111,408 |
I): BLOM preferred Shares Index (BPSI): today’s Performance
| Last | Previous | Change | |
| BPSI | 80.41 | 80.41 | 0.00% |
| Volume | – | – | |
| Value | – | – |
Lebanese Stocks: today’s Trades and Closing Prices
| Last Price ($) | % Change | Volume | VWAP ($) | |
| Solidere A | 5.37 | -4.45% | 201 | 5.37 |
| Solidere B | 5.2 | -1.14% | 50 | 5.2 |
| Byblos Bank – Listed Shares | 1.1 | 0.00% | 41,338 | 1.1 |
| Blom- Listed Shares | 7.29 | 0.00% | 2,700 | 7.29 |
The BLOM Stock Index
Lebanese Global Depository Receipts: Last session’s Performance
| GDRs | Last Price ($) | Previous Price ($) | % Change | Volume | Value ($) |
| BLOM GDR | 6.60 | 6.60 | 0.00% | 17,435.00 | 115,063 |
| Audi GDR | 3.48 | 3.5 | -0.57% | 1,500.00 | 5,220 |
| Byblos GDR | 70 | 70 | 0.00% | – |
Closing Date: 04 Oct. 2019
Source: London Stock Exchange
BLOM BOND INDEX: Last Session’s Performance
| Last | Previous | Change | Y-t-D Change | ||
| BBI | 74.53 | 74.33 | 0.26% | -26.25% | |
| Weighted Yield | 15.88% | 15.95% | -7 | bps | |
| Duration (Years) | 4.78 | 4.77 | |||
| 5Y Bond Yield | 19.30% | 19.30% | 0 | bps | |
| 5Y Spread* | 1,795 | 1,796 | -1 | bps | |
| 10Y Bond Yield | 14.30% | 14.31% | -1 | bps | |
| 10Y Spread* | 1,287 | 1,286 | 1 | bps | |
*between Lebanese Eurobonds and US Treasuries
Closing Date: 04 Oct. 2019
Lebanese Eurobonds: Last Sessions’ Prices and Yields
| Price | Yield | Yield Change | |
| 12/04/2021 | 84.51 | 20.61% | -13 |
| 04/10/2022 | 70.41 | 19.61% | -9 |
| 27/01/2023 | 69.33 | 18.85% | -8 |
| 22/04/2024 | 67.36 | 17.30% | -7 |
| 04/11/2024 | 66.59 | 16.12% | -6 |
| 03/12/2024 | 67.10 | 16.76% | 0 |
| 26/02/2025 | 66.25 | 15.70% | -6 |
| 12/06/2025 | 66.75 | 15.18% | -11 |
| 28/11/2026 | 64.76 | 14.73% | -5 |
| 23/03/2027 | 64.50 | 14.88% | -5 |
| 29/11/2027 | 64.54 | 14.23% | -5 |
| 03/11/2028 | 64.63 | 13.53% | -4 |
| 26/02/2030 | 65.00 | 12.84% | -4 |
| 22/04/2031 | 64.76 | 12.97% | -6 |
| 23/03/2032 | 65.16 | 12.62% | -4 |
| 02/11/2035 | 65.23 | 11.97% | -4 |
| 23/03/2037 | 65.41 | 12.03% | -3 |
Lebanese Forex Market
| Last Price | Previous | % Change | Y-t-D | |
| $/LBP | 1,514.25 | 1,514.25 | – | |
| €/LBP | 1,657.65 | 1,652.82 | 0.29% | |
| £/LBP | 1,857.24 | 1,858.45 | -0.06% | |
| NEER | 119.45 | 119.24 | 0.18% |
Closing Date: 07 Oct. 2019