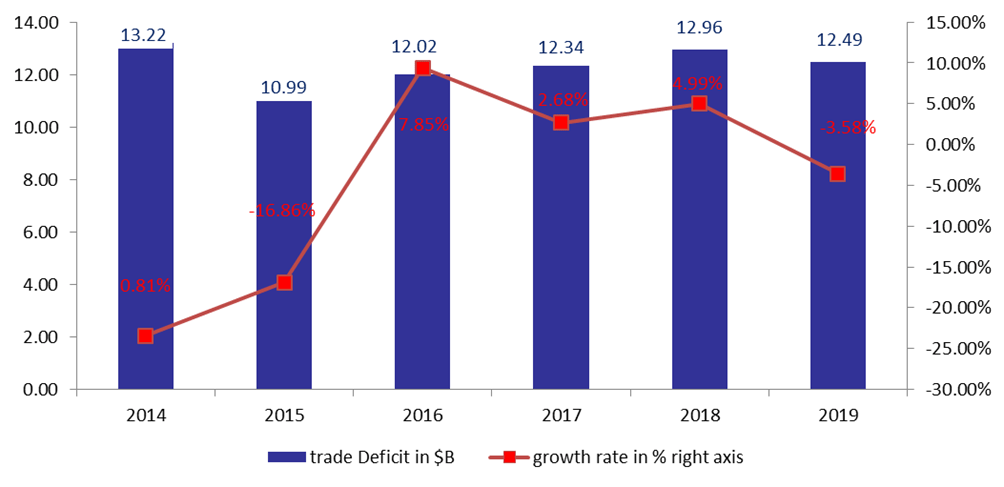
Lebanon’s trade deficit narrowed in the first 9 months of the year to reach $12.49B, down by 3.58% compared to the same period in 2018. In details, the total value of imports gained an annual 0.98% to stand at $15.30B. Also, the value of exports rose by 27.83 %to stand at $2.81B in Q3 2019. Worth noting that “Mineral products “and “Vegetable products” are the only 2 categories to witness an increase in its imported value. As for the month of September alone, total Deficit amounted to $1.12B which is 8.20 % lower when compared to the same month last year.
In term of value, “Mineral products” were the leading imports to Lebanon in Q3 2019, grasping a 34.06% stake of total imported goods. “Products of the chemical or allied industries” followed, constituting 10.17% of the total, while “machinery and electrical instruments” grasped 8.71% of the total.
In details, Lebanon imported $5.21B worth of “Mineral Products”, compared to a value of 3.20B in the same period last year. In fact, the net weight of imported “mineral fuels, oils and their products” is still increasing since the start of the year and witnessed a yearly rise from 4,936,754 tons in Q3 2018 to reach 9,288,583 tons in Q3 2019.
Meanwhile, the value of “chemical or allied industries” recorded a decrease of 5.90% y-o-y to settle at $1.55B and that of “machinery and electrical instruments” also declined by 24.81% over the same period to $1.33B.
In terms of top trade partners, Lebanon primarily imported from US, China, and Russia with shares of 8.65%, 8.58% and 7.65%, respectively, in Q3 2019.
As for exports, the top category of products exported from Lebanon were “pearls, precious stones and metals”, which grasped a share of 38.89% of total exports, followed by a share of 10.09% for “Machinery;electrical instruments “and 9.92% for “Products of the chemical or allied industries “over the same period.
In details, the value of “pearls, precious stones, & metals” surged from 505.38M in Q3 2018 to reach $1.93B in Q3 2019. As for the value of “Machinery;electrical instruments”, it recorded an increase of 25.64% year-on-year to $283.79M. Meanwhile, the value of “Products of the chemical or allied industries”, it increased by 4.24% y-o-y to $278.95M.
In the first 9months of 2019, Switzerland followed by the UAE and Saudi Arabia were Lebanon’s top three export destinations, respectively constituting 27.68%, 11.71%, and 6.40% of total exports.
Yearly Evolution of the Trade Deficit in Q3