Discover today’s performance of BLOM indices, the closing prices of Lebanese stocks and Eurobonds, as well as the exchange rate of major currencies against the LBP.
BLOM Stock Index (BSI) – today’s performance
| Last | Previous | % Change | Y-t-D Change | |
| BSI | 761.05 | 762.58 | -0.20% | -22.09% |
| High | 766.9 | – | ||
| Low | 761.1 | – | ||
| Volume | 60,727 | – | ||
| Val ($) | 322,589 | – |
I): BLOM preferred Shares Index (BPSI): today’s Performance
| Last | Previous | Change | |
| BPSI | 78.67 | 78.67 | 0.00% |
| Volume | – | – | |
| Value | – | – |
Lebanese Stocks: today’s Trades and Closing Prices
| Last Price ($) | % Change | Volume | VWAP ($) | |
| Solidere A | 5.71 | 3.82% | 54,257 | 5.7 |
| Solidere B | 5.67 | 4.23% | 1,470 | 5.7 |
| Byblos Bank – Listed Shares | 1.00 | -8.26% | 5,000 | 1.0 |
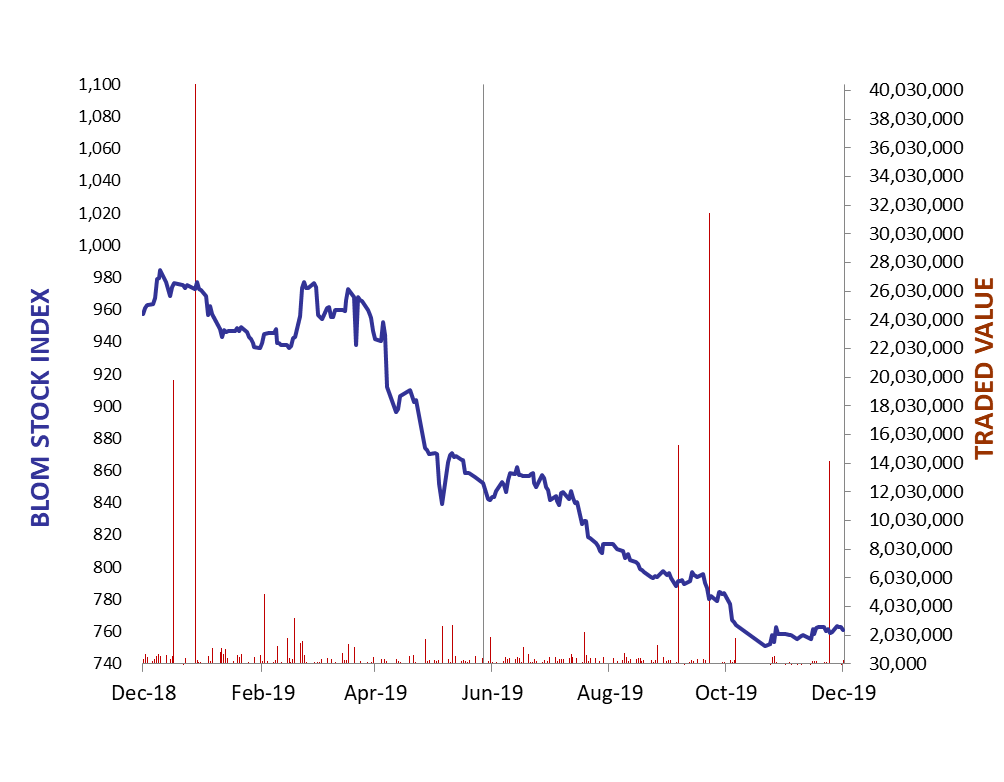
The BLOM Stock Index
Lebanese Global Depository Receipts: Last session’s Performance
| GDRs | Last Price ($) | Previous Price ($) | % Change | Volume | Value ($) |
| BLOM GDR | 1.75 | 1.80 | -2.78% | 5,156 | 9,273 |
| Audi GDR | 1.7 | 1.7 | 0.00% | – | – |
| Byblos GDR | 70 | 70 | 0.00% | – | – |
Closing Date: 11 December 2019
Source: London Stock Exchange
BLOM BOND INDEX: Last Session’s Performance
| Last | Previous | Change | Y-t-D Change | ||
| BBI | 51.77 | 51.21 | 1.09% | -41.21% | |
| Weighted Yield | 28.91% | 29.20% | -28 | bps | |
| Duration (Years) | 4.23 | 4.21 | |||
| 5Y Bond Yield | 36.50% | 37.00% | -50 | bps | |
| 5Y Spread* | 3,488 | 3,533 | -45 | bps | |
| 10Y Bond Yield | 21.15% | 21.50% | -35 | bps | |
| 10Y Spread* | 1,941 | 1,972 | -31 | bps | |
*between Lebanese Eurobonds and US Treasuries
Closing Date: 11 December 2019
Lebanese Eurobonds: Last Sessions’ Prices and Yields
| Price | Yield | Yield Change | |
| 4/12/2021 | 56.98 | 59.02% | -11 |
| 10/4/2022 | 48.31 | 37.26% | -49 |
| 1/27/2023 | 46.80 | 35.49% | -50 |
| 4/22/2024 | 46.16 | 29.30% | -31 |
| 11/4/2024 | 46.16 | 26.54% | -28 |
| 12/3/2024 | 45.89 | 27.76% | 11 |
| 2/26/2025 | 45.80 | 25.62% | -39 |
| 6/12/2025 | 46.43 | 24.51% | -37 |
| 11/28/2026 | 45.80 | 22.28% | -30 |
| 3/23/2027 | 45.71 | 22.23% | -22 |
| 11/29/2027 | 45.80 | 21.09% | -32 |
| 11/3/2028 | 45.80 | 19.90% | -30 |
| 2/26/2030 | 45.80 | 18.76% | -28 |
| 4/22/2031 | 45.87 | 18.66% | -24 |
| 3/23/2032 | 45.71 | 18.20% | -17 |
| 11/2/2035 | 45.80 | 17.04% | -25 |
| 3/23/2037 | 45.80 | 17.10% | -16 |
Lebanese Forex Market
| Last Price | Previous | % Change | Y-t-D | |
| $/LBP | 1,514.25 | 1,514.25 | – | |
| €/LBP | 1,678.15 | 1,678.15 | – | |
| £/LBP | 1,985.98 | 1,989.15 | -0.16% | |
| NEER | 118.04 | 118.26 | -0.19% |
Closing Date: 12 December 2019