Discover today’s performance of BLOM indices, the closing prices of Lebanese stocks and Eurobonds, as well as the exchange rate of major currencies against the LBP.
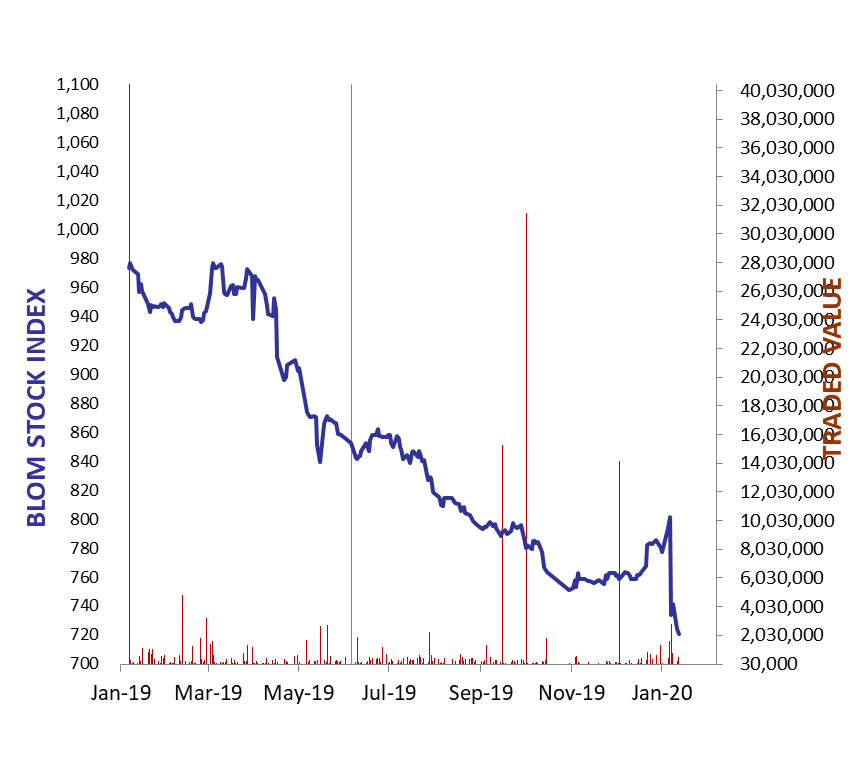
BLOM Stock Index (BSI) – Today’s performance
| Last | Previous | % Change | Y-t-D Change | |
| BSI | 720.66 | 724.41 | -0.52% | -8.26% |
| High | 722.00 | 725.20 | ||
| Low | 719.80 | 723.90 | ||
| Volume | 124,725 | 25,968 | ||
| Val ($) | 506,645 | 219,372 |
I): BLOM preferred Shares Index (BPSI): today’s Performance
| Last | Previous | Change | |
| BPSI | 75.18 | 75.18 | 0.00% |
| Volume | – | – | |
| Value | – | – |
Lebanese Stocks: today’s Trades and Closing Prices
| Last Price ($) | % Change | Volume | VWAP ($) | |
| Solidere A | 8.39 | -2.21% | 47,713 | 8.4 |
| Solidere B | 8.54 | 0.47% | 2,941 | 8.4 |
| Byblos bank | 1 | 0.00% | 30,000 | 1 |
| Bemo | 1.15 | -8.00% | 37,973 | 1.2 |
| Blom Bank | 7 | -0.99% | 100 | 7 |
| BLOM GDR | 3.8 | 0.00% | 5,998 | 3.8 |
The BLOM Stock Index
Lebanese Global Depository Receipts: Last session’s Performance
| GDRs | Last Price ($) | Previous Price ($) | % Change | Volume | Value ($) |
| BLOM GDR | 2.06 | 2.20 | -6.36% | 3,820 | 8,051 |
| Audi GDR | 1.5 | 1.5 | 0.00% | – | – |
| Byblos GDR | 70 | 70 | 0.00% | – | – |
Closing Date: 13 January 2020
Source: London Stock Exchange
BLOM BOND INDEX: Last Session’s Performance
| Last | Previous | Change | Y-t-D Change | ||
| BBI | 50.17 | 49.79 | 0.77% | -0.86% | |
| Weighted Yield | 30.44% | 30.78% | -34 | bps | |
| Duration (Years) | 4.09 | 4.09 | |||
| 5Y Bond Yield | 38.20% | 39.00% | -80 | bps | |
| 5Y Spread* | 3,660 | 3,741 | -81 | bps | |
| 10Y Bond Yield | 28.20% | 23.50% | 470 | bps | |
| 10Y Spread* | 2,644 | 2,176 | 468 | bps | |
*between Lebanese Eurobonds and US Treasuries
Closing Date: 13 January 2020
Lebanese Eurobonds: Last Sessions’ Prices and Yields
| Price | Yield | Yield Change | |
| 4/12/2021 | 56.94 | 62.85% | -175 |
| 10/4/2022 | 48.05 | 38.49% | -61 |
| 1/27/2023 | 45.19 | 37.87% | 0 |
| 4/22/2024 | 44.48 | 30.91% | -14 |
| 11/4/2024 | 44.48 | 27.94% | -9 |
| 12/3/2024 | 43.96 | 29.34% | -4 |
| 2/26/2025 | 43.98 | 27.04% | -17 |
| 6/12/2025 | 44.61 | 25.81% | 8 |
| 11/28/2026 | 43.98 | 23.35% | -15 |
| 3/23/2027 | 43.88 | 23.28% | -2 |
| 11/29/2027 | 43.92 | 22.08% | -11 |
| 11/3/2028 | 43.84 | 20.85% | -6 |
| 2/26/2030 | 43.62 | 19.71% | -13 |
| 4/22/2031 | 43.74 | 19.56% | -5 |
| 3/23/2032 | 43.83 | 18.97% | -3 |
| 11/2/2035 | 43.84 | 17.76% | -11 |
| 3/23/2037 | 44.01 | 17.77% | -4 |
Lebanese Forex Market
| Last Price | Previous | % Change | Y-t-D | |
| $/LBP | 1,514.25 | 1,514.25 | – | |
| €/LBP | 1,676.79 | 1,676.49 | 0.02% | |
| £/LBP | 1,958.24 | 1,969.40 | -0.57% | |
| NEER | 117.82 | 117.53 | 0.25% |
Closing Date: 14 January 2020