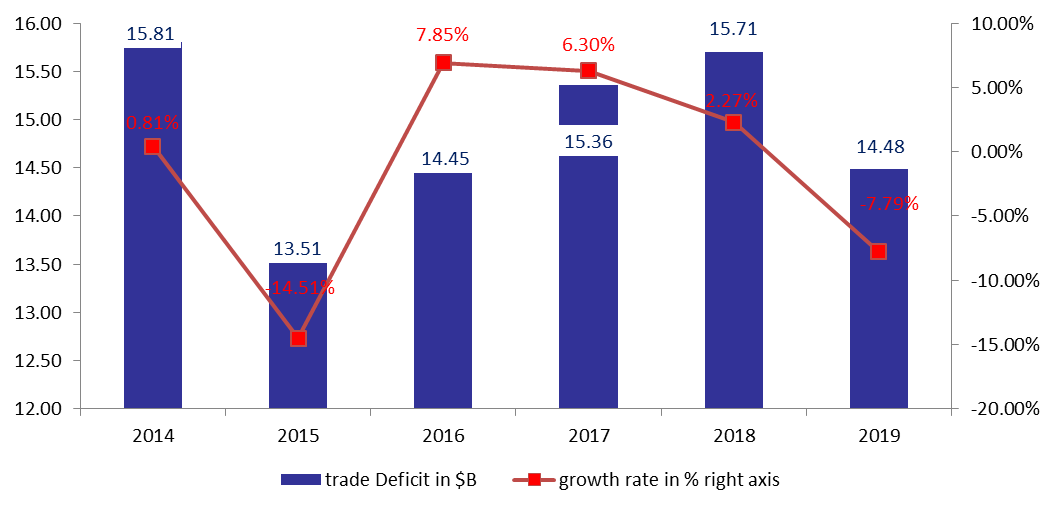
Lebanon’s trade deficit narrowed in the first 11 months of the year to reach $14.81B, down by 7.79% compared to the same period in 2018. In details, the total value of imports lost an annual 2.81% to stand at $17.89B. Also, the value of exports rose by 26.10 %to stand at $3.41B by November 2019. Worth noting that “Mineral products “is the only category to witness an increase in its imported value.
In term of value, “Mineral products” were the leading imports to Lebanon in the first 11 months of the year, grasping a 33.48% stake of total imported goods. “Products of the chemical or allied industries” followed, constituting 10.34% of the total, while “machinery and electrical instruments” grasped 8.75% of the total.
In details, Lebanon imported $5.99B worth of “Mineral Products”, compared to a value of 3.81B in the same period last year and increasing by 57.2%. In fact, the net weight of imported “mineral fuels, oils and their products” is still increasing since the start of the year and witnessed a yearly rise from 5,843,029 tons by November 2018 to reach 10,770,178 tons by November 2019.
Meanwhile, the value of “chemical or allied industries” recorded a decrease of 8.38% y-o-y to settle at $1.85B and that of “machinery and electrical instruments” also declined by 27.39% over the same period to $1.56B.
In terms of top trade partners, Lebanon primarily imported from US, China, and Russia with shares of 8.74%, 8.61% and 7.19%, respectively, by November 2019.
As for exports, the top category of products exported from Lebanon were “pearls, precious stones and metals”, which grasped a share of 39.09% of total exports, followed by a share of 10.09% for “Machinery;electrical instruments “and 10.02% for “Products of the chemical or allied industries “over the same period.
In details, the value of “pearls, precious stones, & metals” surged from 593.30M by November 2018 to reach $1.33B by November 2019. As for the value of “Machinery;electrical instruments”, it recorded an increase of 16.35% year-on-year to $344.37M. Meanwhile, the value of “Products of the chemical or allied industries”, it increased by 3.74% y-o-y to $342M.
In the first 11 months of 2019, Switzerland followed by the UAE and Saudi Arabia were Lebanon’s top three export destinations, respectively constituting 28.36%, 11.60%, and 6.43% of total exports.
Worth mentioning that during the month of November alone, total deficit amounted to $972.49B which is 24.87 % lower when compared to the same month last year. This can be related to the shortage of foreign currency and the different restrictions on transactions imposed by local bank in 2019. In fact, the central bank has been covering imports of essential goods, including fuel, wheat and medicine.
Yearly Evolution of the Trade Deficit by November