Discover today’s performance of BLOM indices, the closing prices of Lebanese stocks and Eurobonds, as well as the exchange rate of major currencies against the LBP.
BLOM Stock Index (BSI) – Today’s performance
| Last | Previous | % Change | Y-t-D Change | |
| BSI | 698.14 | 706.66 | -1.21% | -11.13% |
| High | 706.40 | 714.90 | ||
| Low | 697.90 | 696.20 | ||
| Volume | 89,864 | 248,486 | ||
| Val ($) | 666,565 | 2,030,145 |
I): BLOM preferred Shares Index (BPSI): today’s Performance
| Last | Previous | Change | |
| BPSI | 75.40 | 75.40 | 0.00% |
| Volume | 280 | – | |
| Value | 7,000 | – |
Lebanese Stocks: today’s Trades and Closing Prices
| Last Price ($) | % Change | Volume | VWAP ($) | |
| Solidere A | 8.18 | -4.55% | 60,327 | 8.3 |
| Solidere B | 8.6 | -0.69% | 13,247 | 8.5 |
| Bank of Beirut Pref J | 25 | 0.00% | 280 | 25 |
| BLOM GDR | 3.23 | -15.00% | 10 | 3.2 |
| CB (N) | 2.9 | 7.41% | 18,000 | 2.9 |
Closing Date: 23 January 2020
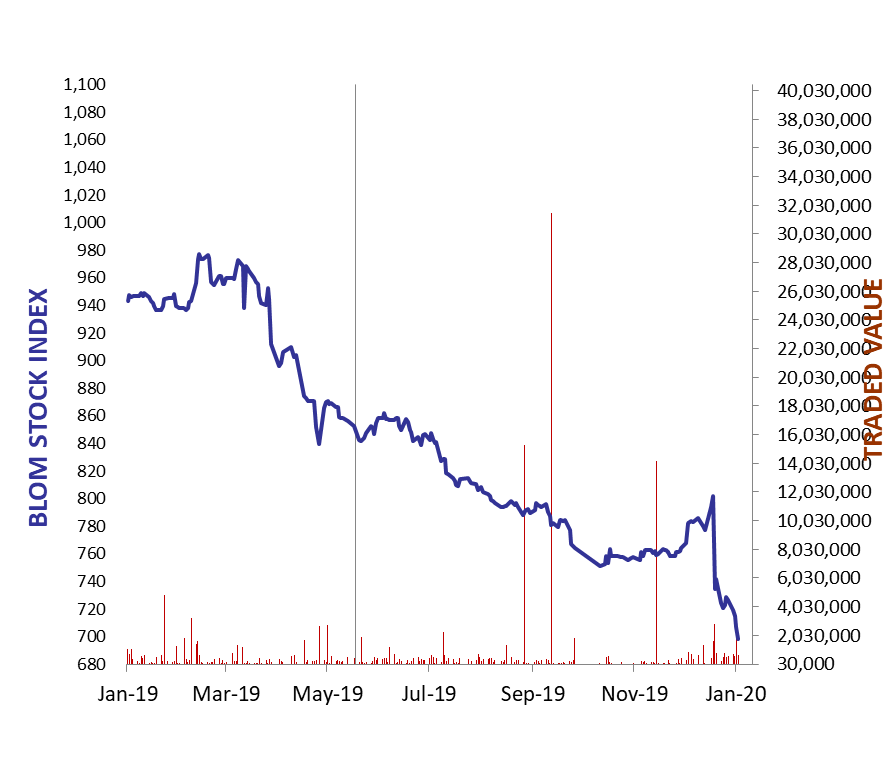
The BLOM Stock Index
Lebanese Global Depository Receipts: Last Session’s Performance
| GDRs | Last Price ($) | Previous Price ($) | % Change | Volume | Value ($) |
| BLOM GDR | 1.95 | 1.95 | 0.00% | ||
| Audi GDR | 1.5 | 1.5 | 0.00% | – | – |
| Byblos GDR | 70 | 70 | 0.00% | – | – |
Closing Date: 22 January 2020
Source: London Stock Exchange
BLOM BOND INDEX: Last Session’s Performance
| Last | Previous | Change | Y-t-D Change | ||
| BBI | 48.32 | 47.39 | 1.97% | -4.51% | |
| Weighted Yield | 31.93% | 32.71% | -78 | bps | |
| Duration (Years) | 3.99 | 3.97 | |||
| 5Y Bond Yield | 39.80% | 40.80% | -100 | bps | |
| 5Y Spread* | 3,828 | 3,927 | -99 | bps | |
| 10Y Bond Yield | 23.38% | 23.40% | -2 | bps | |
| 10Y Spread* | 2,170 | 2,171 | -1 | bps | |
*between Lebanese Eurobonds and US Treasuries
Closing Date: 22 January 2020
Lebanese Eurobonds: Last Sessions’ Prices and Yields
| Price | Yield | Yield Change | |
| 12/04/2021 | 55.36 | 67.18% | -253 |
| 04/10/2022 | 47.26 | 39.59% | -129 |
| 27/01/2023 | 43.86 | 39.48% | -73 |
| 22/04/2024 | 42.79 | 32.33% | -48 |
| 04/11/2024 | 42.86 | 29.14% | -45 |
| 03/12/2024 | 42.10 | 30.75% | -32 |
| 26/02/2025 | 42.41 | 28.16% | -61 |
| 12/06/2025 | 43.31 | 26.68% | -69 |
| 28/11/2026 | 42.05 | 24.43% | -38 |
| 23/03/2027 | 42.00 | 24.33% | -39 |
| 29/11/2027 | 41.99 | 23.08% | -37 |
| 03/11/2028 | 41.91 | 21.77% | -52 |
| 26/02/2030 | 41.46 | 20.69% | -23 |
| 22/04/2031 | 41.70 | 20.45% | -33 |
| 23/03/2032 | 41.86 | 19.80% | -32 |
| 02/11/2035 | 41.78 | 18.56% | -36 |
| 23/03/2037 | 41.86 | 18.61% | -30 |
Lebanese Forex Market
| Last Price | Previous | % Change | Y-t-D | |
| $/LBP | 1,514.25 | 1,514.25 | – | |
| Euro/LBP | 1,670.91 | 1,672.27 | -0.08% | |
| £/LBP | 1,978.29 | 1,981.16 | -0.14% | |
| NEER | 117.96 | 117.91 | 0.04% |
Closing Date: 23 January 2020