Discover today’s performance of BLOM indices, the closing prices of Lebanese stocks and Eurobonds, as well as the exchange rate of major currencies against the LBP.
BLOM Stock Index (BSI) – Today’s performance
| Last | Previous | % Change | Y-t-D Change | |
| BSI | 621.54 | 617.64 | 0.63% | -20.88% |
| High | 625.28 | 620.23 | ||
| Low | 617.13 | 617.50 | ||
| Volume | 53,357 | 418,522 | ||
| Val ($) | 438,527 | 3,684,523 |
I): BLOM preferred Shares Index (BPSI): today’s Performance
| Last | Previous | Change | |
| BPSI | 66.67 | 66.67 | 0.00% |
| Volume | – | – | |
| Value | – | – |
Lebanese Stocks: today’s Trades and Closing Prices
| Last Price ($) | % Change | Volume | VWAP ($) | |
| Solidere A | 9.00 | 2.86% | 27,927 | 9 |
| Solidere B | 9.00 | 3.81% | 19,424 | 9 |
| Byblod Bank -listed | 0.90 | 5.88% | 1,000 | 0.9 |
| BLOM Listed | 3.83 | -4.25% | 6 | 3.8 |
| CB (N) | 2.9 | 0.00% | 5,000 | 2.9 |
Closing Date: 13 March 2020
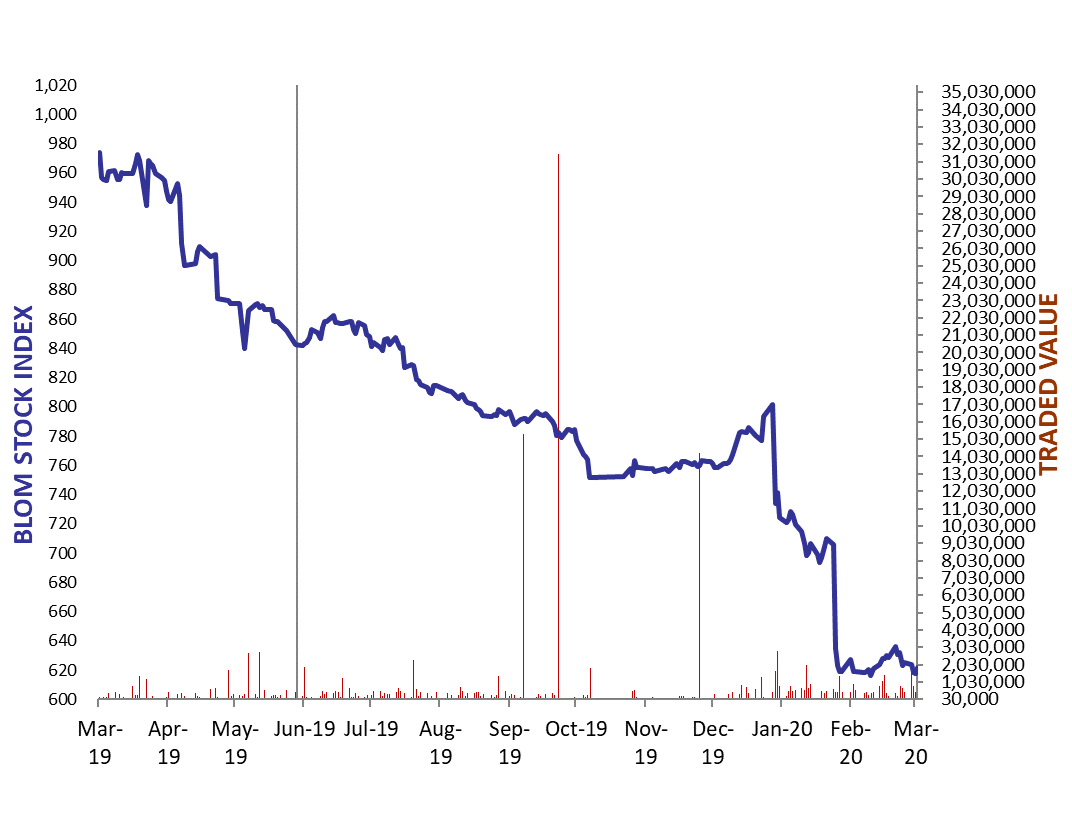
The BLOM Stock Index
Lebanese Global Depository Receipts: Last Session’s Performance
| GDRs | Last Price ($) | Previous Price ($) | % Change | Volume | Value ($) |
| BLOM GDR | 1.99 | 1.76 | 13.07% | 5,058 | 10,065 |
| Audi GDR | 1.4 | 1.4 | 0.00% | – | – |
| Byblos GDR | 70 | 70 | 0.00% | – | – |
Closing Date: March 12, 2020
Source: London Stock Exchange
BLOM BOND INDEX: Last Session’s Performance
| Last | Previous | Change | Y-t-D Change | ||
| BBI | 23.74 | 24.29 | -2.24% | -53.03% | |
| Weighted Yield | 72.02% | 71.11% | 91 | bps | |
| Duration (Years) | 2.89 | 2.94 | |||
| 5Y Bond Yield | 83.00% | 82.00% | 100 | bps | |
| 5Y Spread* | 8,242 | 8,142 | 100 | bps | |
| 10Y Bond Yield | 40.05% | 40.02% | 3 | bps | |
| 10Y Spread* | 3,916 | 3,920 | -4 | bps | |
*between Lebanese Eurobonds and US Treasuries
Closing Date: 13 March 2020
Lebanese Eurobonds: Last Sessions’ Prices and Yields
| Price | Yield | Yield Change | |
| 12/04/2021 | 22.67 | 222.00% | 76 |
| 04/10/2022 | 21.28 | 88.00% | 157 |
| 27/01/2023 | 21.95 | 76.88% | (43) |
| 22/04/2024 | 21.82 | 58.96% | 134 |
| 04/11/2024 | 21.99 | 52.43% | 119 |
| 03/12/2024 | 21.87 | 54.18% | 133 |
| 26/02/2025 | 21.76 | 50.37% | 119 |
| 12/06/2025 | 22.49 | 47.30% | 117 |
| 28/11/2026 | 21.46 | 43.03% | 106 |
| 23/03/2027 | 21.77 | 42.39% | 103 |
| 29/11/2027 | 21.59 | 40.29% | 13 |
| 03/11/2028 | 21.82 | 37.61% | 95 |
| 26/02/2030 | 21.75 | 35.63% | 90 |
| 22/04/2031 | 21.88 | 35.39% | 91 |
| 23/03/2032 | 21.74 | 34.86% | 96 |
| 02/11/2035 | 21.77 | 33.29% | 94 |
| 23/03/2037 | 21.76 | 33.88% | 99 |
Lebanese Forex Market
| Last Price | Previous | % Change | Y-t-D | |
| $/LBP | 1,514.25 | 1,514.25 | – | |
| €/LBP | 1,681.92 | 1,691.26 | -0.55% | |
| £/LBP | 1,851.51 | 1,917.99 | -3.47% | |
| NEER | 120.52 | 119.92 | 0.50% |
Closing Date: 16 March 2020