Discover today’s performance of BLOM indices, the closing prices of Lebanese stocks and Eurobonds, as well as the exchange rate of major currencies against the LBP.
BLOM Stock Index (BSI) – today’s performance
| Last | Previous | % Change | Y-t-D Change | |
| BSI | 574.74 | 580.51 | -0.99% | -26.84% |
| High | 580.81 | 583.63 | ||
| Low | 572.41 | 578.21 | ||
| Volume | 15,855 | 21,030 | ||
| Val ($) | 107,244 | 223,173 |
I): BLOM preferred Shares Index (BPSI): today’s Performance
| Last | Previous | Change | |
| BPSI | 62.69 | 62.69 | 0.00% |
| Volume | |||
| Value |
Lebanese Stocks: today’s Trades and Closing Prices
| Last Price ($) | % Change | Volume | VWAP ($) | |
| Solidere A | 10.72 | 1.13% | 9,071 | 10.7 |
| Solidere B | 10.67 | -0.19% | 41 | 10.7 |
| Bank Audi GDR | 1.39 | -30.50% | 6,653 | 1.4 |
| Blom Bank GDR | 3.50 | 0.00% | 6 | 3.5 |
| HOLCIM | 10.01 | 0.00% | 84 | 10.01 |
Closing Date: June 10, 2020
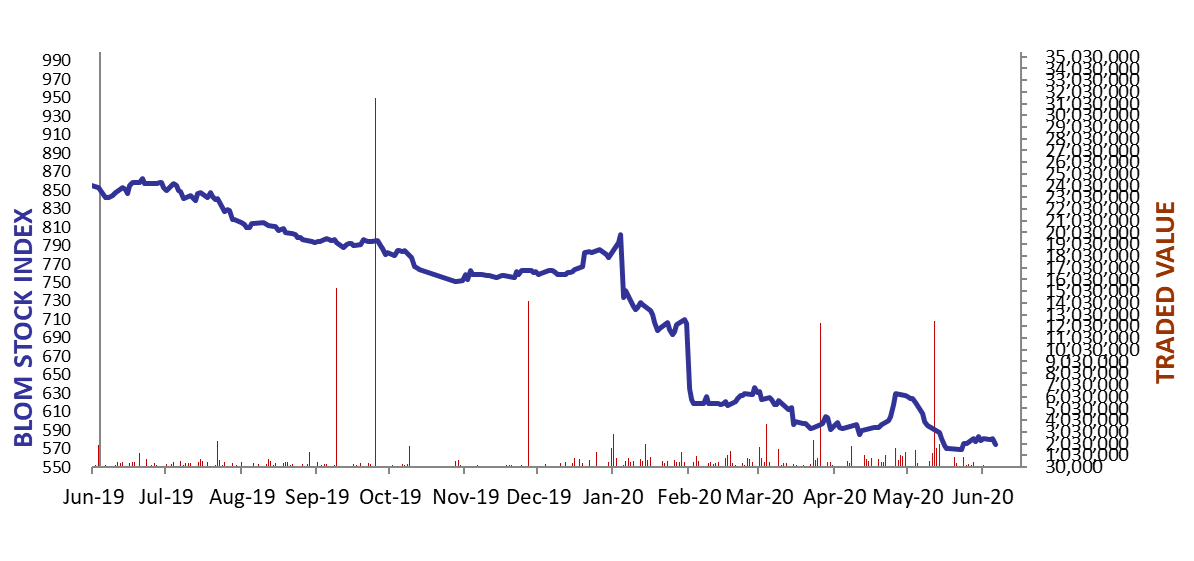
The BLOM Stock Index
Lebanese Global Depository Receipts: Last Session’s Performance
| Global Depository Receipts (GDRs) | Last Price ($) | Previous Price ($) June 03rd 2020 | % Change | Volume | Value ($) |
| BLOM GDR | 1.500 | 1.500 | 0.00% | 64,537 | 96,806 |
| Audi GDR | 0.43 | 0.42 | 2.38% | 2,400 | 1,032 |
| Byblos GDR | 70 | 70 | 0.00% | – | – |
Closing Date: June 9, 2020
Source: London Stock Exchange
BLOM BOND INDEX: Last Session’s Performance
| Last | Previous | Change | Y-t-D Change | ||
| BBI | 17.91 | 17.65 | 1.46% | -64.58% | |
| Weighted Yield | 57.57% | 58.18% | -61 | bps | |
| Duration (Years) | 3.01 | 2.99 | |||
| 5Y Bond Yield | 99.00% | 100.40% | -140 | bps | |
| 5Y Spread* | 9,880 | 10,018 | -138 | bps | |
| 10Y Bond Yield | 45.50% | 45.90% | -40 | bps | |
| 10Y Spread* | 4,510 | 4,545 | -35 | bps | |
*spread between Lebanese Eurobonds and US Treasuries
Closing Date: June 09, 2020
Lebanese Eurobonds: Last Sessions’ Prices and Yields
| Price | Yield | Yield Change | |
| 10/4/2022 | 19.00 | 104.92% | (190) |
| 1/27/2023 | 18.83 | 93.17% | 41 |
| 4/22/2024 | 18.75 | 68.87% | (127) |
| 11/4/2024 | 18.75 | 61.22% | 20 |
| 12/3/2024 | 18.50 | 63.79% | (59) |
| 2/26/2025 | 18.58 | 58.30% | (99) |
| 6/12/2025 | 19.50 | 54.34% | 56 |
| 11/28/2026 | 18.90 | 48.33% | (46) |
| 3/23/2027 | 18.88 | 47.90% | (143) |
| 11/29/2027 | 18.83 | 45.48% | (33) |
| 11/3/2028 | 18.67 | 43.01% | (3) |
| 2/26/2030 | 18.88 | 40.18% | (38) |
| 4/22/2031 | 18.26 | 41.50% | 46 |
| 3/23/2032 | 18.58 | 39.97% | (1) |
| 11/2/2035 | 19.38 | 37.18% | (91) |
| 3/23/2037 | 19.63 | 37.34% | (140) |
Lebanese Forex Market
| Last Price | Previous | % Change | Y-t-D | |
| $/LBP | 1,514.25 | 1,514.25 | – | |
| €/LBP | 1,710.71 | 1,628.40 | 5.05% | |
| £/LBP | 1,919.35 | 1,861.01 | 3.13% | |
| NEER | 120.99 | 121.48 | -0.40% |
Closing Date: June 10, 2020