Discover today’s performance of BLOM indices, the closing prices of Lebanese stocks and Eurobonds, as well as the exchange rate of major currencies against the LBP.
BLOM Stock Index (BSI) – today’s performance
| Last | Previous | % Change | Y-t-D Change | |
| BSI | 612.22 | 599.45 | 2.13% | -22.06% |
| High | 612.47 | 600.02 | ||
| Low | 599.46 | 598.20 | ||
| Volume | 4,944,282 | 168,744 | ||
| Val ($) | 5,889,632 | 1,299,924 |
I): BLOM preferred Shares Index (BPSI): today’s Performance
| Last | Previous | Change | |
| BPSI | 62.69 | 62.69 | 0.00% |
| Volume | – | – | |
| Value | – | – |
Lebanese Stocks: today’s Trades and Closing Prices
| Last Price ($) | % Change | Volume | VWAP ($) | |
| Solidere A | 13.00 | 6.21% | 97,533 | 13 |
| Solidere B | 13.00 | 6.73% | 29,036 | 13.00 |
| Audi Bank Listed Shares | 0.88 | -1.12% | 4,812,379 | 0.90 |
| RYMCO | 3.00 | -8.54% | 1,667 | 3 |
| HOLCIM | 11.00 | 5.16% | 1,667 | 11 |
| CB (N) | 3.80 | 0.00% | 2,000 | 3.80 |
Closing Date: June 30, 2020
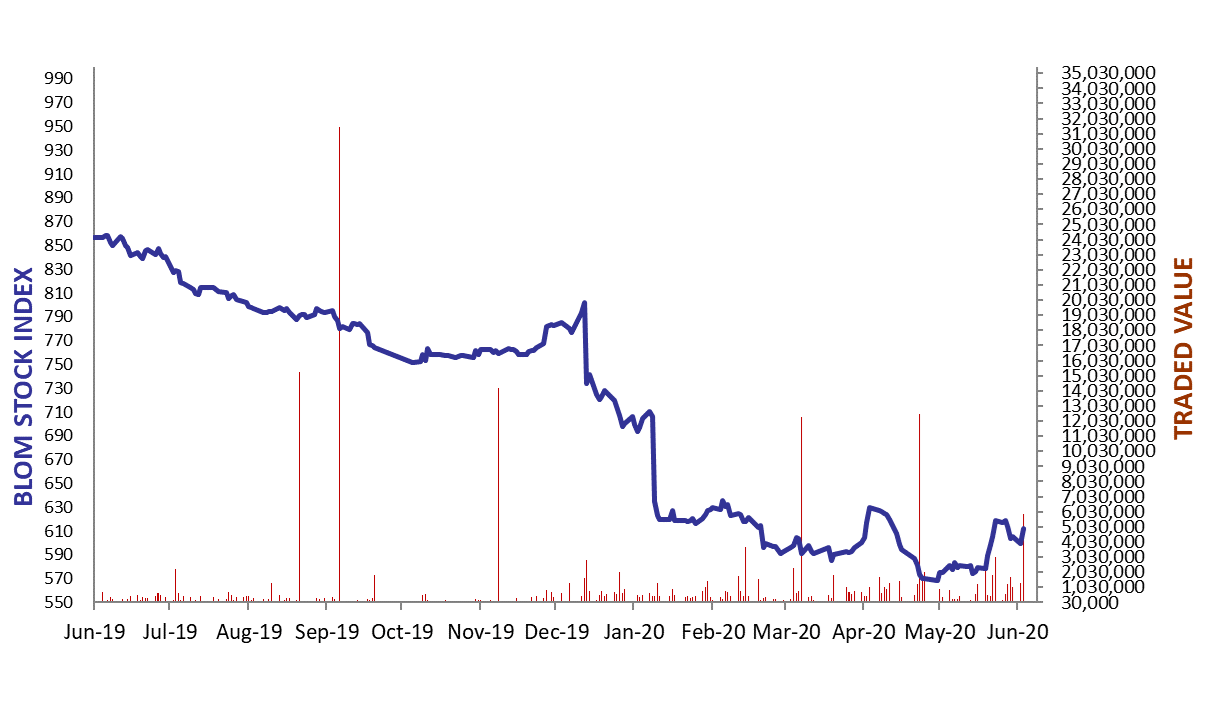
The BLOM Stock Index
Lebanese Global Depository Receipts: Last Session’s Performance
| Global Depository Receipts (GDRs) | Last Price ($) | Previous Price ($) | % Change | Volume | Value ($) |
| BLOM GDR | 1.30 | 1.40 | -7.14% | 270 | 351 |
| Audi GDR | 0.41 | 0.41 | 0.00% | – | – |
| Byblos GDR | 70 | 70 | 0.00% | – | – |
Closing Date: June 30, 2020
Source: London Stock Exchange
BLOM BOND INDEX: Last Session’s Performance
| Last | Previous | Change | Y-t-D Change | ||
| BBI | 16.55 | 16.82 | -1.64% | -67.27% | |
| Weighted Yield | 61.43% | 60.61% | 82 | bps | |
| Duration (Years) | 2.83 | 2.87 | |||
| 5Y Bond Yield | 107.00% | 105.00% | 200 | bps | |
| 5Y Spread* | 10,684 | 10,483 | 201 | bps | |
| 10Y Bond Yield | 48.90% | 48.00% | 90 | bps | |
| 10Y Spread* | 4,862 | 4,770 | 92 | bps | |
*spread between Lebanese Eurobonds and US Treasuries
Closing Date: June 29 2020
Lebanese Eurobonds: Last Sessions’ Prices and Yields
| Price | Yield | Yield Change | |
| 10/4/2022 | 18.25 | 110.49% | 146 |
| 1/27/2023 | 17.58 | 99.82% | 137 |
| 4/22/2024 | 17.38 | 73.24% | 83 |
| 11/4/2024 | 17.42 | 64.83% | 116 |
| 12/3/2024 | 17.08 | 67.64% | 52 |
| 2/26/2025 | 17.55 | 61.11% | 44 |
| 6/12/2025 | 18.08 | 57.60% | 64 |
| 11/28/2026 | 17.55 | 51.13% | 34 |
| 3/23/2027 | 17.13 | 51.59% | 57 |
| 11/29/2027 | 17.25 | 48.61% | 94 |
| 11/3/2028 | 17.17 | 45.84% | 107 |
| 2/26/2030 | 17.13 | 43.47% | 51 |
| 4/22/2031 | 16.92 | 44.11% | 119 |
| 3/23/2032 | 17.17 | 42.77% | 112 |
| 11/2/2035 | 17.63 | 40.50% | 53 |
| 3/23/2037 | 17.63 | 41.30% | 55 |
Lebanese Forex Market
| Last Price | Previous | % Change | Y-t-D | |
| $/LBP | 1,514.25 | 1,514.25 | – | |
| €/LBP | 1,687.34 | 1,706.19 | -1.10% | |
| £/LBP | 1,849.55 | 1,905.48 | -2.94% | |
| NEER | 122.16 | 121.75 | 0.34% |
Closing Date: June 30, 2020