Discover today’s performance of BLOM indices, the closing prices of Lebanese stocks and Eurobonds, as well as the exchange rate of major currencies against the LBP.
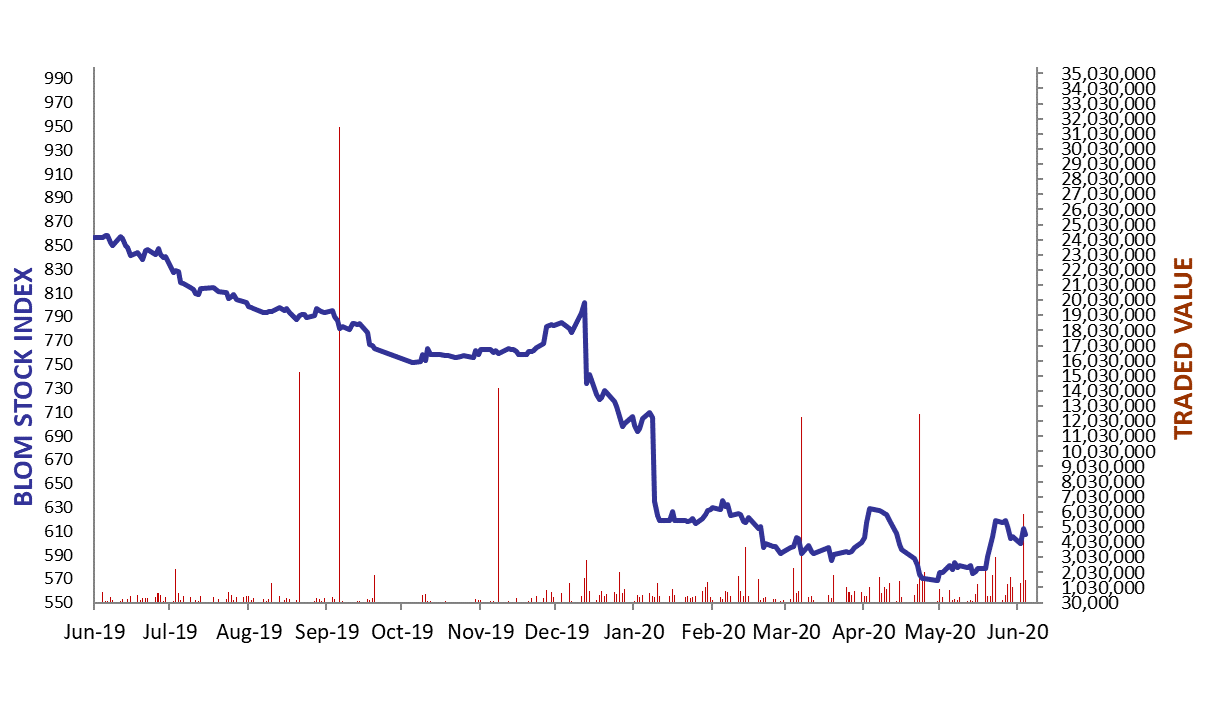
BLOM Stock Index (BSI) – today’s performance
| Last | Previous | % Change | Y-t-D Change | |
| BSI | 607.13 | 612.22 | -0.83% | -22.71% |
| High | 612.23 | 612.47 | ||
| Low | 603.70 | 599.46 | ||
| Volume | 115,414 | 4,944,282 | ||
| Val ($) | 1,531,719 | 5,889,632 |
I): BLOM preferred Shares Index (BPSI): today’s Performance
| Last | Previous | Change | |
| BPSI | 62.69 | 62.69 | 0.00% |
| Volume | – | – | |
| Value | – | – |
Lebanese Stocks: today’s Trades and Closing Prices
| Last Price ($) | % Change | Volume | VWAP ($) | |
| Solidere A | 13.35 | 2.69% | 108,774 | 13.35 |
| Solidere B | 13.45 | 3.46% | 6,538 | 13.45 |
| Blom Bank Listed Shares | 3.37 | -9.89% | 100 | 3.37 |
| Blom GDR | 3.00 | -14.29% | 2 | 3 |
Closing Date: July 1, 2020
The BLOM Stock Index
Lebanese Global Depository Receipts: Last Session’s Performance
| Global Depository Receipts (GDRs) | Last Price ($) | Previous Price ($) | % Change | Volume | Value ($) |
| BLOM GDR | 1.30 | 1.40 | -7.14% | 270 | 351 |
| Audi GDR | 0.41 | 0.41 | 0.00% | – | – |
| Byblos GDR | 70 | 70 | 0.00% | – | – |
Closing Date: June 30, 2020
Source: London Stock Exchange
BLOM BOND INDEX: Last Session’s Performance
| Last | Previous | Change | Y-t-D Change | ||
| BBI | 16.30 | 16.55 | -1.49% | -67.76% | |
| Weighted Yield | 62.15% | 61.43% | 72 | bps | |
| Duration (Years) | 2.80 | 2.83 | |||
| 5Y Bond Yield | 109.00% | 107.00% | 200 | bps | |
| 5Y Spread* | 10,884 | 10,684 | 200 | bps | |
| 10Y Bond Yield | 49.00% | 48.90% | 10 | bps | |
| 10Y Spread* | 4,871 | 4,862 | 9 | bps | |
*spread between Lebanese Eurobonds and US Treasuries
Closing Date: June 30 2020
Lebanese Eurobonds: Last Sessions’ Prices and Yields
| Price | Yield | Yield Change | |
| 10/4/2022 | 17.88 | 112.27% | 177 |
| 1/27/2023 | 17.48 | 100.37% | 54 |
| 4/22/2024 | 17.00 | 74.37% | 113 |
| 11/4/2024 | 17.48 | 64.71% | (12) |
| 12/3/2024 | 16.67 | 68.82% | 118 |
| 2/26/2025 | 17.33 | 61.68% | 57 |
| 6/12/2025 | 17.98 | 57.86% | 26 |
| 11/28/2026 | 17.13 | 52.05% | 91 |
| 3/23/2027 | 16.75 | 52.43% | 84 |
| 11/29/2027 | 17.13 | 48.88% | 27 |
| 11/3/2028 | 17.13 | 45.93% | 9 |
| 2/26/2030 | 16.75 | 44.24% | 78 |
| 4/22/2031 | 16.90 | 44.15% | 4 |
| 3/23/2032 | 17.13 | 42.86% | 9 |
| 11/2/2035 | 17.25 | 41.32% | 82 |
| 3/23/2037 | 17.25 | 42.15% | 86 |
Lebanese Forex Market
| Last Price | Previous | % Change | Y-t-D | |
| $/LBP | 1,514.25 | 1,514.25 | – | |
| €/LBP | 1,687.65 | 1,706.19 | -1.09% | |
| £/LBP | 1,867.64 | 1,905.48 | -1.99% | |
| NEER | 129.46 | 122.16 | 5.98% |
Closing Date: July 1, 2020