Lebanon’s trade deficit for the first 8 months of 2014 broadened to $11.87B, up from $11.47B. Accordingly, trade deficit broadened by 3.54% year-on-year (y-o-y) as exports declined at a faster pace than imports. Lebanon’s exports covered 15.79% of the imports by August 2014, down from 20.05% for the same period in 2013.
Total imports decreased 1.69% y-o-y to $14.10B. The three main product groups imported to Lebanon were mineral products, which increased by 5.56% y-o-y (25% share of total imports), electrical instruments, which dropped by 15.55% y-o-y (11% share of total imports) and chemical products, which rose 3.55% y-o-y (10% share of total imports). The three major countries that Lebanon imports products from were China, Germany and Belgium, with respective weights of 12%, 6% and 4%.
Meanwhile, total exports shrunk by 22.55% to $2.23B. The three main product groups exported from Lebanon were pearls, precious stones and metals, which declined by 35.64% y-o-y (17.92% share of total exports), followed by prepared foodstuffs such as beverages and tobacco, which increased by 18.17% y-o-y (15.35% share of total exports), and finally electrical instruments, which shrunk by 16.42% y-o-y (13.35% share of total exports). The three major countries that Lebanon exports products to were South Africa, Saudi Arabia and the United Arab Emirates, with respective weights of 11%, 11% and 9%, respectively.
Lebanon’s trade deficit for the month of August broadened to $1.83B, revealing an 18.56% y-o-y increase from August 2013. The widening in August 2014 is attributed to the 15.99% y-o-y uptick in imports compared to August 2013, while exports increased by a mere 1.82% y-o-y.
Total Imports and Exports by August (In $B)
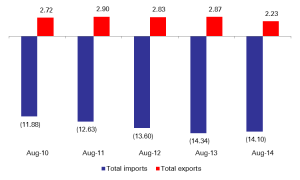
Source: Lebanese Customs