Discover today’s performance of BLOM indices, the closing prices of Lebanese stocks and Eurobonds, as well as the exchange rate of major currencies against the LBP.
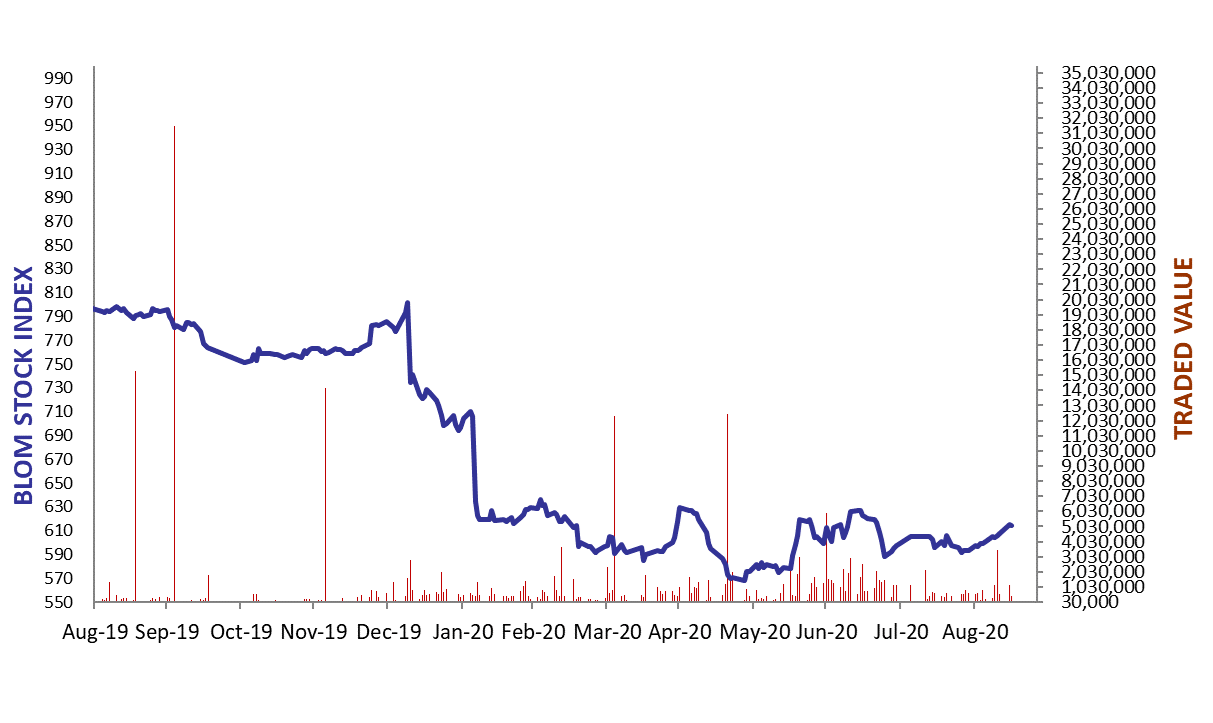
BLOM Stock Index (BSI) – today’s performance
| Last | Previous | % Change | Y-t-D Change | |
| BSI | 614.47 | 614.89 | -0.07% | -21.78% |
| High | 616.19 | 623.28 | ||
| Low | 611.49 | 613.39 | ||
| Volume | 41,089 | 66,678 | ||
| Val ($) | 418,304 | 1,133,756 |
I): BLOM preferred Shares Index (BPSI): today’s Performance
| Last | Last | Change | |
| BPSI | 52.86 | 52.86 | 0.00% |
| Volume | 4,278 | ||
| Value | 181,205 |
Lebanese Stocks: today’s Trades and Closing Prices
| Last Price ($) | % Change | Volume | VWAP ($) | |
| Solidere A | 15.45 | -0.32% | 17,037 | 15.40 |
| Solidere B | 15.36 | -0.52% | 7,052 | 15.30 |
| Blom Bank Listed Shares | 2.81 | 0.36% | 15,000 | 2.80 |
| BLOM GDR | 3.00 | 1.69% | 2,000 | 3.00 |
Closing Date: September 15, 2020
The BLOM Stock Index
Lebanese Global Depository Receipts: Last Session’s Performance
| Global Depository Receipts (GDRs) | Last Price ($) | Previous Price ($) | % Change | Volume | Value ($) |
| BLOM GDR | 1.55 | 1.55 | 0.00% | 59,988 | 92,981 |
| Audi GDR | 0.36 | 0.36 | 0.00% | ||
| Byblos GDR | 70 | 70 | 0.00% |
Closing Date: September 14, 2020
Source: London Stock Exchange
BLOM BOND INDEX: Last Session’s Performance
| Last | Previous | Change | Y-t-D Change | ||
| BBI | 16.57 | 16.71 | -0.85% | -67.23% | |
| Weighted Yield | 64.21% | 63.65% | 56 | bps | |
| Duration (Years) | 2.69 | 2.72 | |||
| 5Y Bond Yield | 58.50% | 58.00% | 50 | bps | |
| 5Y Spread* | 5,850 | 5,800 | 50 | bps | |
| 10Y Bond Yield | 44.20% | 44.00% | 20 | bps | |
| 10Y Spread* | 4,420 | 4,400 | 20 | bps | |
*spread between Lebanese Eurobonds and US Treasuries
Closing Date: September 14, 2020
Lebanese Eurobonds: Last Sessions’ Prices and Yields
| Price | Yield | Yield Change | |
| 10/4/2022 | 18.00 | 123.64% | 137 |
| 1/27/2023 | 17.84 | 107.16% | 119 |
| 4/22/2024 | 17.25 | 77.06% | 59 |
| 11/4/2024 | 17.63 | 66.75% | 60 |
| 12/3/2024 | 17.50 | 68.68% | 36 |
| 2/26/2025 | 17.53 | 63.39% | 53 |
| 6/12/2025 | 18.33 | 58.69% | 48 |
| 11/28/2026 | 17.53 | 52.07% | 42 |
| 3/23/2027 | 17.25 | 52.34% | 34 |
| 11/29/2027 | 17.53 | 48.63% | 39 |
| 11/3/2028 | 17.30 | 46.07% | 38 |
| 2/26/2030 | 16.88 | 44.39% | 26 |
| 4/22/2031 | 17.15 | 43.87% | 39 |
| 3/23/2032 | 17.38 | 42.63% | 39 |
| 11/2/2035 | 17.38 | 41.11% | 28 |
| 3/23/2037 | 17.50 | 41.76% | 30 |
Lebanese Forex Market
| Last Price | Previous | % Change | Y-t-D | |
| $/LBP | 1,514.25 | 1,514.25 | – | |
| €/LBP | 1,791.06 | 1,788.80 | 0.13% | |
| £/LBP | 1,944.07 | 1,936.32 | 0.40% | |
| NEER | 127.33 | 127.46 | -0.10% |
Closing Date: September 15, 2020