Discover today’s performance of BLOM indices, the closing prices of Lebanese stocks and Eurobonds, as well as the exchange rate of major currencies against the LBP.
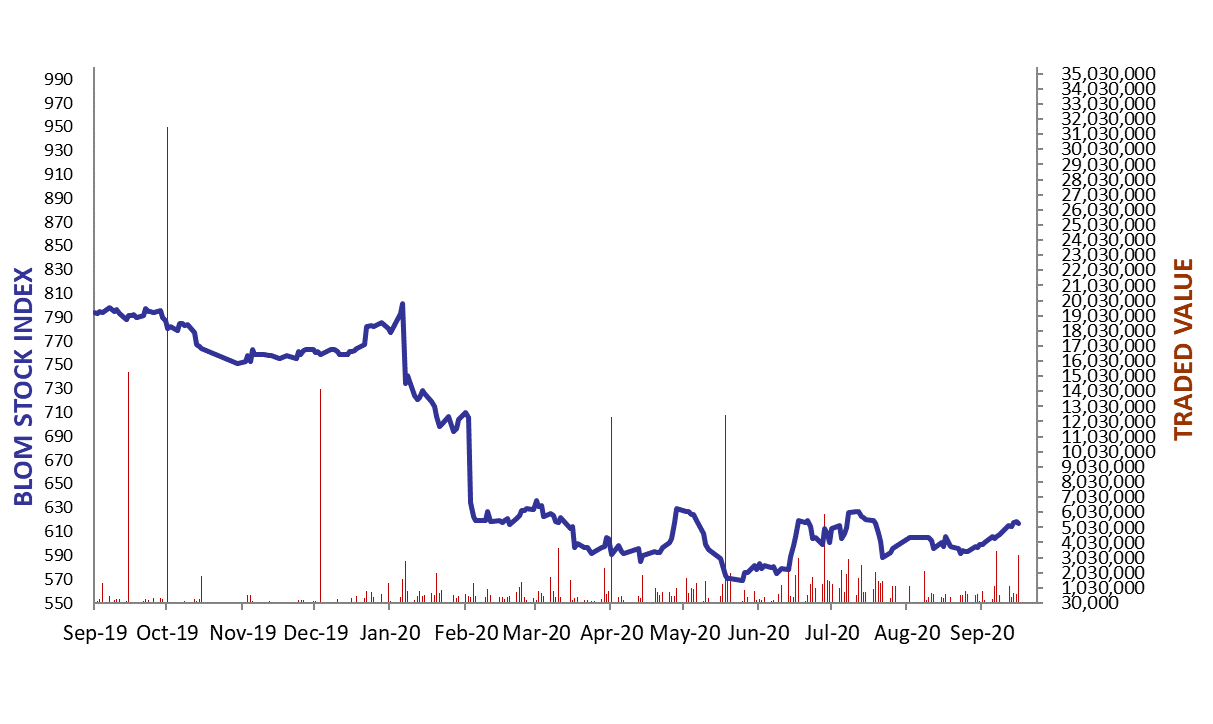
BLOM Stock Index (BSI) – today’s performance
| Last | Previous | % Change | Y-t-D Change | |
| BSI | 616.46 | 618.13 | -0.27% | -21.53% |
| High | 617.21 | 619.69 | ||
| Low | 615.20 | 615.43 | ||
| Volume | 3,962,766 | 59,329 | ||
| Val ($) | 3,180,736 | 593,223 |
I): BLOM preferred Shares Index (BPSI): today’s Performance
| Last | Last | Change | |
| BPSI | 50.16 | 52.86 | -5.11% |
| Volume | 24,395 | – | |
| Value | 1,103,167 | – |
Lebanese Stocks: today’s Trades and Closing Prices
| Last Price ($) | % Change | Volume | VWAP ($) | |
| Solidere A | 15.97 | 0.31% | 19,017 | 15.88 |
| Solidere B | 15.77 | 0.19% | 5,238 | 15.77 |
| Byblos Bank Listed Shares | 0.36 | 2.86% | 3,797,953 | 0.36 |
| Byblos Bank Pref 2008 | 39.99 | -19.84% | 10,000 | 40.00 |
| Byblos Bank Pref 2009 | 48.85 | -7.39% | 14,395 | 48.90 |
| BLOM Bank Listed Shares | 2.80 | -0.36% | 114,163 | 2.80 |
| BLOM GDR | 3.00 | 0.00% | 2,000 | 3.00 |
Closing Date: September 18, 2020
The BLOM Stock Index
Lebanese Global Depository Receipts: Last Session’s Performance
| Global Depository Receipts (GDRs) | Last Price ($) | Previous Price ($) | % Change | Volume | Value ($) |
| BLOM GDR | 1.60 | 1.55 | 3.23% | 10,652 | 17,043 |
| Audi GDR | 0.36 | 0.36 | 0.00% |
Closing Date: September 16, 2020
Source: London Stock Exchange
BLOM BOND INDEX: Last Session’s Performance
| Last | Previous | Change | Y-t-D Change | ||
| BBI | 16.59 | 16.81 | -1.30% | -67.19% | |
| Weighted Yield | 64.32% | 63.60% | 72 | bps | |
| Duration (Years) | 2.68 | 2.71 | |||
| 5Y Bond Yield | 58.20% | 57.90% | 30 | bps | |
| 5Y Spread* | 5,820 | 5,777 | 43 | bps | |
| 10Y Bond Yield | 43.80% | 43.50% | 30 | bps | |
| 10Y Spread* | 4,380 | 4,322 | 58 | bps | |
*spread between Lebanese Eurobonds and US Treasuries
Closing Date: September 17, 2020
Lebanese Eurobonds: Last Sessions’ Prices and Yields
| Price | Yield | Yield Change | |
| 10/4/2022 | 18.00 | 124.21% | 206 |
| 1/27/2023 | 17.71 | 108.07% | 130 |
| 4/22/2024 | 17.25 | 77.22% | 118 |
| 11/4/2024 | 17.46 | 67.30% | 67 |
| 12/3/2024 | 17.42 | 69.01% | 48 |
| 2/26/2025 | 17.53 | 63.47% | 27 |
| 6/12/2025 | 18.46 | 58.47% | 39 |
| 11/28/2026 | 17.60 | 51.95% | 17 |
| 3/23/2027 | 17.38 | 52.12% | 50 |
| 11/29/2027 | 17.50 | 48.71% | 35 |
| 11/3/2028 | 17.17 | 46.36% | 72 |
| 2/26/2030 | 17.13 | 43.88% | 53 |
| 4/22/2031 | 17.30 | 43.57% | (28) |
| 3/23/2032 | 17.25 | 42.92% | 59 |
| 11/2/2035 | 17.38 | 41.11% | 65 |
| 3/23/2037 | 17.50 | 41.78% | 61 |
Lebanese Forex Market
| Last Price | Previous | % Change | Y-t-D | |
| $/LBP | 1,514.25 | 1,514.25 | – | |
| €/LBP | 1,785.48 | 1,786.09 | -0.03% | |
| £/LBP | 1,958.54 | 1,955.68 | 0.15% | |
| NEER | 127.43 | 127.68 | -0.20% |
Closing Date: September 18, 2020