
Discover today’s performance of BLOM indices, the closing prices of Lebanese stocks and Eurobonds, as well as the exchange rate of major currencies against the LBP.
BLOM Stock Index (BSI) – today’s performance
| Last | Previous | % Change | Y-t-D Change | |
| BSI | 673.87 | 666.06 | 1.17% | 2.90% |
| High | 673.95 | 666.89 | ||
| Low | 664.90 | 659.17 | ||
| Volume | 107,478 | 172,891 | ||
| Val ($) | 886,775 | 1,142,751 |
I): BLOM preferred Shares Index (BPSI): today’s Performance
| Last | Previous | Change | |
| BPSI | 47.64 | 47.64 | 0.00% |
| Volume | |||
| Value |
Lebanese Stocks: today’s Trades and Closing Prices
| Last Price ($) | % Change | Volume | VWAP ($) | |
| Solidere A | 19.47 | 3.56% | 31,219 | 19.13 |
| Solidere B | 18.88 | 1.07% | 11,259 | 18.78 |
| Bank Audi GDR | 1.20 | 0.00% | 65,000 | 1.20 |
Closing Date: February 11, 2021
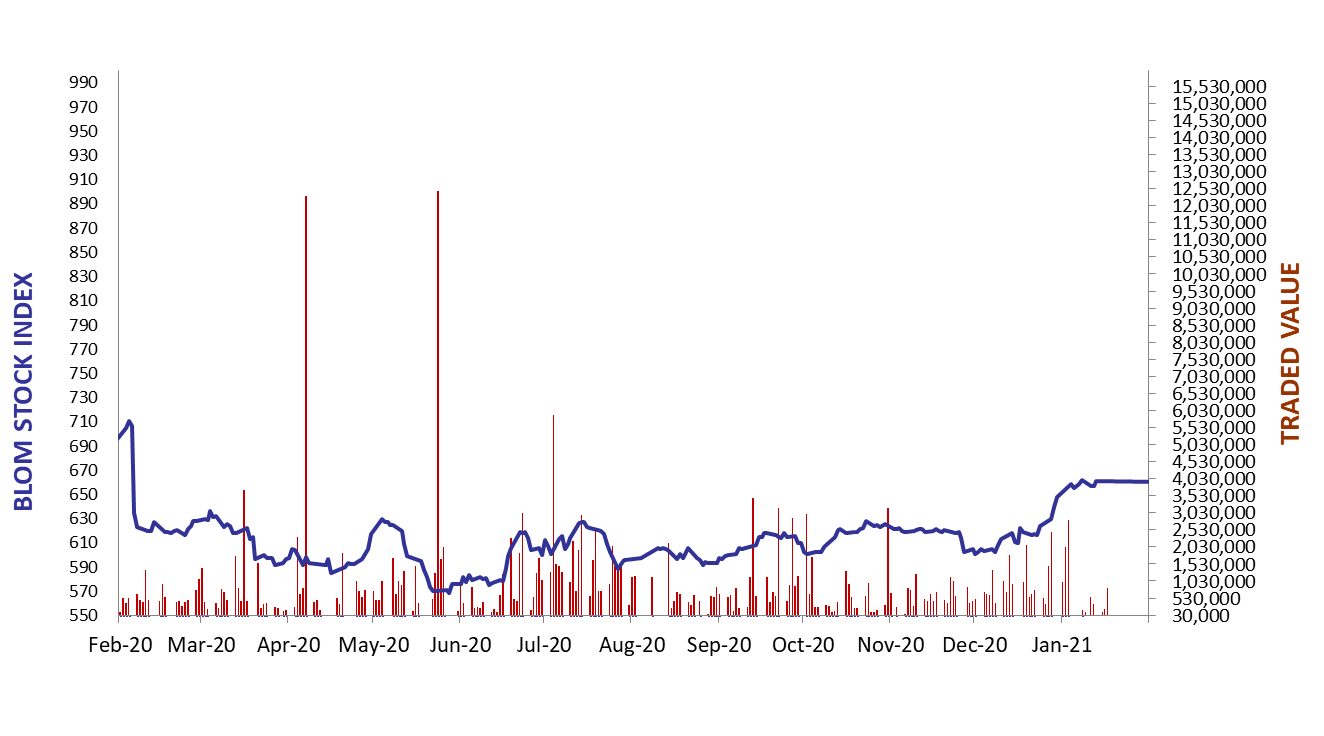
The BLOM Stock Index
BLOM BOND INDEX: Last Session’s Performance
| Last | Previous | Change | Y-t-D Change | ||
| BBI | 14.78 | 14.78 | 0.01% | -0.40% | |
| Weighted Yield | 86.41% | 86.25% | 16 | bps | |
| Duration (Years) | 2.24 | 2.24 | |||
| 5Y Bond Yield | 71.00% | 70.90% | 10 | bps | |
| 5Y Spread* | 7,054 | 7,042 | 12 | bps | |
| 10Y Bond Yield | 54.20% | 54.10% | 10 | bps | |
| 10Y Spread* | 5,305 | 5,292 | 13 | bps | |
*spread between Lebanese Eurobonds and US Treasuries
Closing Date: February 10, 2021
Lebanese Eurobonds: Last Sessions’ Prices and Yields
| Price | Yield | Yield Change | |
| 10/4/2022 | 13.53 | 191.31% | 83 |
| 1/27/2023 | 13.50 | 158.13% | 43 |
| 4/22/2024 | 13.50 | 99.79% | 15 |
| 11/4/2024 | 13.50 | 86.19% | 10 |
| 12/3/2024 | 13.43 | 88.34% | 8 |
| 2/26/2025 | 13.54 | 80.88% | 11 |
| 6/12/2025 | 13.74 | 75.96% | 9 |
| 11/28/2026 | 13.58 | 64.68% | (4) |
| 3/23/2027 | 13.52 | 64.26% | 13 |
| 11/29/2027 | 13.50 | 60.47% | (8) |
| 11/3/2028 | 13.50 | 56.66% | 2 |
| 2/26/2030 | 13.48 | 53.89% | 4 |
| 4/22/2031 | 13.51 | 54.07% | 1 |
| 3/23/2032 | 13.53 | 53.24% | (29) |
| 11/2/2035 | 13.55 | 51.99% | (10) |
| 3/23/2037 | 13.66 | 52.96% | 53 |
Lebanese Forex Market
Closing Date: February 11, 2021