
Discover today’s performance of BLOM indices, the closing prices of Lebanese stocks and Eurobonds, as well as the exchange rate of major currencies against the LBP.
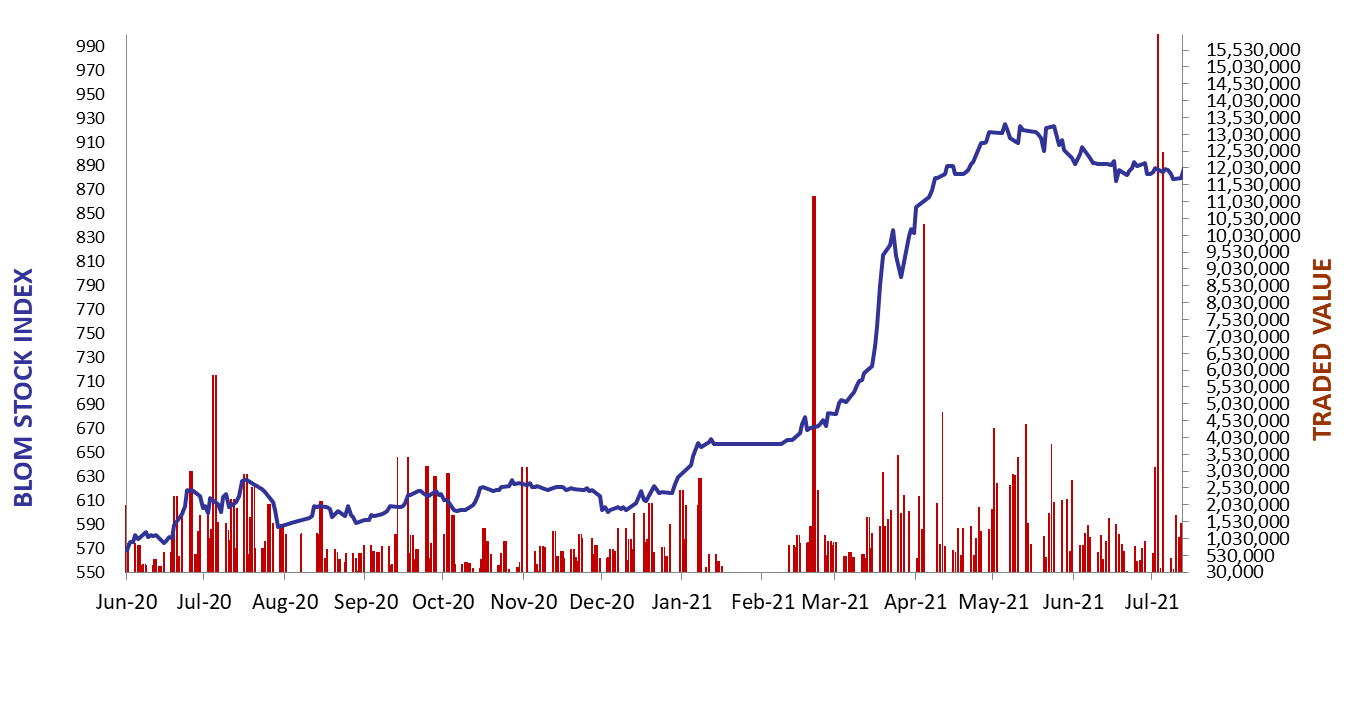
BLOM Stock Index (BSI) – today’s performance
| Last | Previous | % Change | Y-t-D Change | |
| BSI | 903.72 | 896.28 | 0.83% | 38.00% |
| High | 898.45 | 897.45 | ||
| Low | 904.12 | 895.13 | ||
| Volume | 16,089 | 13,215 | ||
| Val ($) | 415,979 | 312,652 |
I): BLOM preferred Shares Index (BPSI): today’s Performance
| Last | Previous | Change | |
| BPSI | 45.57 | 45.57 | 0.00% |
| Volume | |||
| Value |
Lebanese Stocks: today’s Trades and Closing Prices
| Last Price ($) | % Change | Volume | VWAP ($) | |
| Solidere A | 26.01 | 1.76% | 14,977 | 25.84 |
| Solidere B | 25.99 | 1.88% | 1,112 | 25.99 |
Closing Date: July 23, 2021
The BLOM Stock Index
| Last | Previous | Change | ||
| BBI | 12.99 | 13.03 | -0.29% | |
| Weighted Yield | 86.04% | 85.67% | 37 | bps |
| Duration (Years) | 2.21 | 2.23 | ||
| 5Y Bond Yield | 75.05% | 74.80% | 25 | bps |
| 5Y Spread* | 7,435 | 7,401 | 34 | bps |
| 10Y Bond Yield | 57.75% | 57.82% | -7 | bps |
| 10Y Spread* | 5,656 | 5,651 | 5 | bps |
BLOM BOND INDEX: Last Session’s Performance
| Price | Yield | Yield Change | |
| 1/27/2023 | 12.55 | 223.43% | 181 |
| 4/22/2024 | 12.63 | 118.74% | 14 |
| 11/4/2024 | 12.56 | 100.18% | 10 |
| 12/3/2024 | 12.61 | 101.50% | 16 |
| 2/26/2025 | 12.56 | 92.86% | 20 |
| 6/12/2025 | 12.74 | 86.63% | 23 |
| 11/28/2026 | 12.48 | 71.80% | 29 |
| 3/23/2027 | 12.52 | 70.51% | 11 |
| 11/29/2027 | 12.55 | 65.89% | 13 |
| 11/3/2028 | 12.39 | 61.88% | 67 |
| 2/26/2030 | 12.41 | 58.35% | 24 |
| 4/22/2031 | 12.61 | 57.85% | (3) |
| 3/23/2032 | 12.29 | 58.24% | 64 |
| 11/2/2035 | 12.58 | 55.90% | (3) |
| 3/23/2037 | 13.14 | 54.92% | 11 |
*spread between Lebanese Eurobonds and US Treasuries
Closing Date: July 19, 2021
Lebanese Forex Market
| Last Price | Previous | % Change | |
| $/LBP | 1,514.25 | 1,514.25 | – |
| €/LBP | 1,772.82 | 1,774.48 | -0.09% |
| £/LBP | 2,069.19 | 2,075.53 | -0.31% |
| NEER | 141.29 | 141.31 | -0.01% |
Closing Date: July 23, 2021