Eurobonds, as well as the exchange rate of major currencies against the LBP.
BLOM Stock Index (BSI) – today’s performance
| Last | Previous | % Change | Y-t-D Change | |
| BSI | 972.30 | 971.72 | 0.06% | -3.07% |
| High | 974.06 | 975.45 | ||
| Low | 972.30 | 970.12 | ||
| Volume | 61,581 | 72,489 | ||
| Val ($) | 1,560,333 | 709,262 |
I): BLOM preferred Shares Index (BPSI): today’s Performance
| Last | Previous | Change | |
| BPSI | 44.99 | 44.99 | 0.00% |
| Volume | |||
| Value |
Lebanese Stocks: today’s Trades and Closing Prices
| Last Price ($) | % Change | Volume | VWAP ($) | |
| Solidere A | 30.44 | -0.20% | 50,557 | 30.41 |
| Bank Audi | 2.1 | 0.00% | 7,224 | 2.1 |
| Bank Audi GDR | 2 | 5.26% | 3800 | 2 |
Closing Date: February 03, 2022
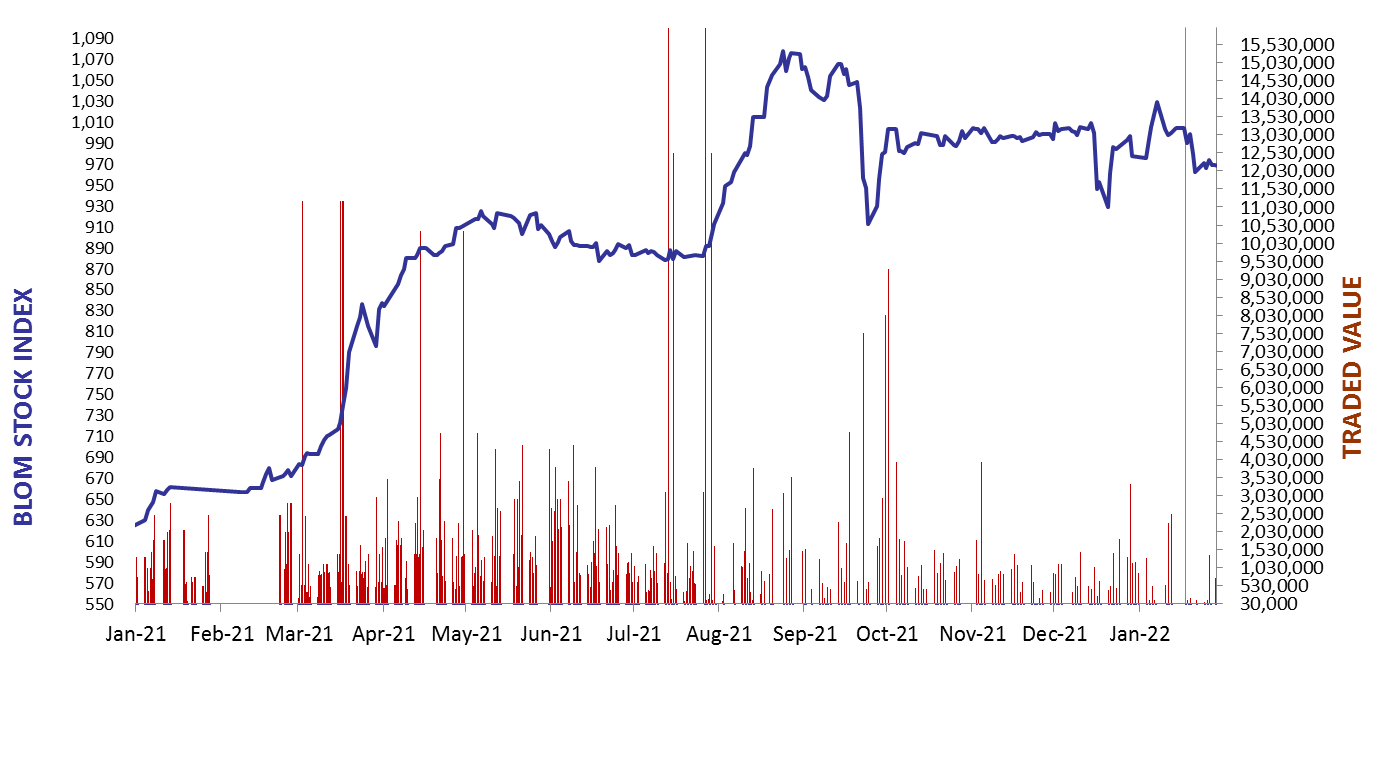
The BLOM Stock Index
| Last | Previous | Change | Y-t-D Change | ||
| BBI | 11.70 | 11.45 | 2.20% | 6.17% | |
| Weighted Yield | 85.21% | 86.48% | -126 | bps | |
| Duration (Years) | 2.07 | 2.04 | |||
| 5Y Bond Yield | 81.50% | 82.50% | -100 | bps | |
| 5Y Spread* | 8,012 | 8,111 | -99 | bps | |
| 10Y Bond Yield | 64.00% | 65.40% | -140 | bps | |
| 10Y Spread* | 6,226 | 6,364 | -138 | bps | |
BLOM BOND INDEX: Last Session’s Performance
| Price | Yield | Yield Change | |
| 4/22/2024 | 11.31 | 156.83% | (230) |
| 11/4/2024 | 11.19 | 126.13% | (117) |
| 12/3/2024 | 11.16 | 126.86% | (130) |
| 2/26/2025 | 11.15 | 114.96% | (81) |
| 6/12/2025 | 11.41 | 104.58% | (93) |
| 11/28/2026 | 11.21 | 82.25% | (102) |
| 3/23/2027 | 11.19 | 80.60% | (99) |
| 11/29/2027 | 11.16 | 74.77% | (82) |
| 11/3/2028 | 11.34 | 68.24% | (189) |
| 2/26/2030 | 11.50 | 63.33% | (126) |
| 4/22/2031 | 10.94 | 66.01% | (198) |
| 3/23/2032 | 11.21 | 63.75% | (117) |
| 11/2/2035 | 11.46 | 61.20% | (287) |
| 3/23/2037 | 11.94 | 60.39% | (92) |
*spread between Lebanese Eurobonds and US Treasuries
Closing Date: February 2, 2021
Lebanese Forex Market
| Last Price | Previous | % Change | Y-t-D | |
| $/LBP | 1,514.25 | 1,514.25 | – | |
| €/LBP | 1,704.08 | 1,703.93 | 0.01% | |
| £/LBP | 2,048.39 | 2,046.73 | 0.08% | |
| NEER | 152.24 | 151.92 | 0.21% |
Closing Date: February 03, 2022