Discover today’s performance of BLOM indices, the closing prices of Lebanese stocks and Eurobonds, as well as the exchange rate of major currencies against the LBP.
BLOM Stock Index (BSI) – today’s performance
| Last | Previous | % Change | Y-t-D Change | |
| BSI | 972.38 | 970.05 | 0.24% | -3.07% |
| High | 973.27 | 972.41 | ||
| Low | 971.27 | 959.85 | ||
| Volume | 10,640 | 158,010 | ||
| Val ($) | 333,486 | 555,216 |
I): BLOM preferred Shares Index (BPSI): today’s Performance
| Last | Previous | Change | |
| BPSI | 44.99 | 44.99 | 0.00% |
| Volume | |||
| Value |
Lebanese Stocks: today’s Trades and Closing Prices
| Last Price ($) | % Change | Volume | VWAP ($) | |
| Solidere A | 31.42 | -0.25% | 6,267 | 31.4 |
| Solidere B | 31.41 | 1.58% | 4,373 | 31.26 |
Closing Date: March 14, 2022
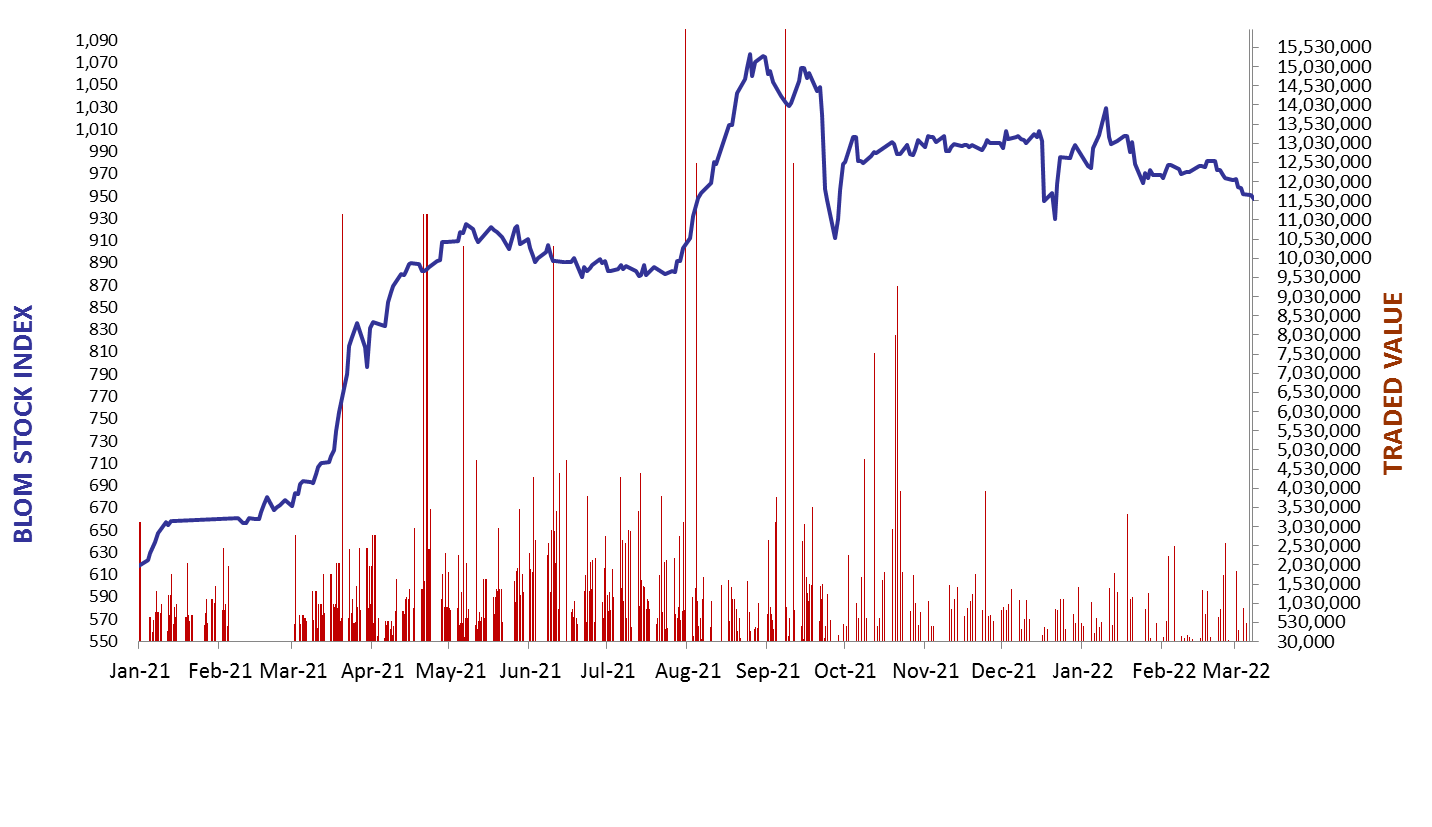
The BLOM Stock Index
| Last | Previous | Change | Y-t-D Change | ||
| BBI | 11.88 | 11.88 | 0.03% | 7.82% | |
| Weighted Yield | 86.12% | 86.05% | 7 | bps | |
| Duration (Years) | 2.06 | 2.06 | |||
| 5Y Bond Yield | 77.85% | 78.15% | -30 | bps | |
| 5Y Spread* | 7,594 | 7,627 | -33 | bps | |
| 10Y Bond Yield | 61.34% | 61.15% | 19 | bps | |
| 10Y Spread* | 5,933 | 5,917 | 16 | bps | |
BLOM BOND INDEX: Last Session’s Performance
| Price | Yield | Yield Change | |
| 4/22/2024 | 11.47 | 164.27% | 103 |
| 11/4/2024 | 11.42 | 129.56% | 80 |
| 12/3/2024 | 11.36 | 129.76% | 21 |
| 2/26/2025 | 11.46 | 116.94% | 37 |
| 6/12/2025 | 11.73 | 105.55% | 25 |
| 11/28/2026 | 11.47 | 82.22% | (19) |
| 3/23/2027 | 11.45 | 80.76% | (37) |
| 11/29/2027 | 11.48 | 74.00% | (20) |
| 11/3/2028 | 11.48 | 68.18% | 17 |
| 2/26/2030 | 11.56 | 63.46% | (1) |
| 4/22/2031 | 11.26 | 64.76% | 14 |
| 3/23/2032 | 11.43 | 63.06% | 19 |
| 11/2/2035 | 11.51 | 61.08% | 2 |
| 3/23/2037 | 11.49 | 63.08% | (30) |
*spread between Lebanese Eurobonds and US Treasuries
Closing Date: March 11, 2022
Lebanese Forex Market
| Last Price | Previous | % Change | Y-t-D | |
| $/LBP | 1,514.25 | 1,514.25 | – | |
| €/LBP | 1,651.62 | 1,644.53 | 0.43% | |
| £/LBP | 1,970.60 | 1,965.18 | 0.28% | |
| NEER | 158.60 | 158.44 | 0.10% |
Closing Date: March 14, 2022