
Discover today’s performance of BLOM indices, the closing prices of Lebanese stocks and Eurobonds, as well as the exchange rate of major currencies against the LBP.
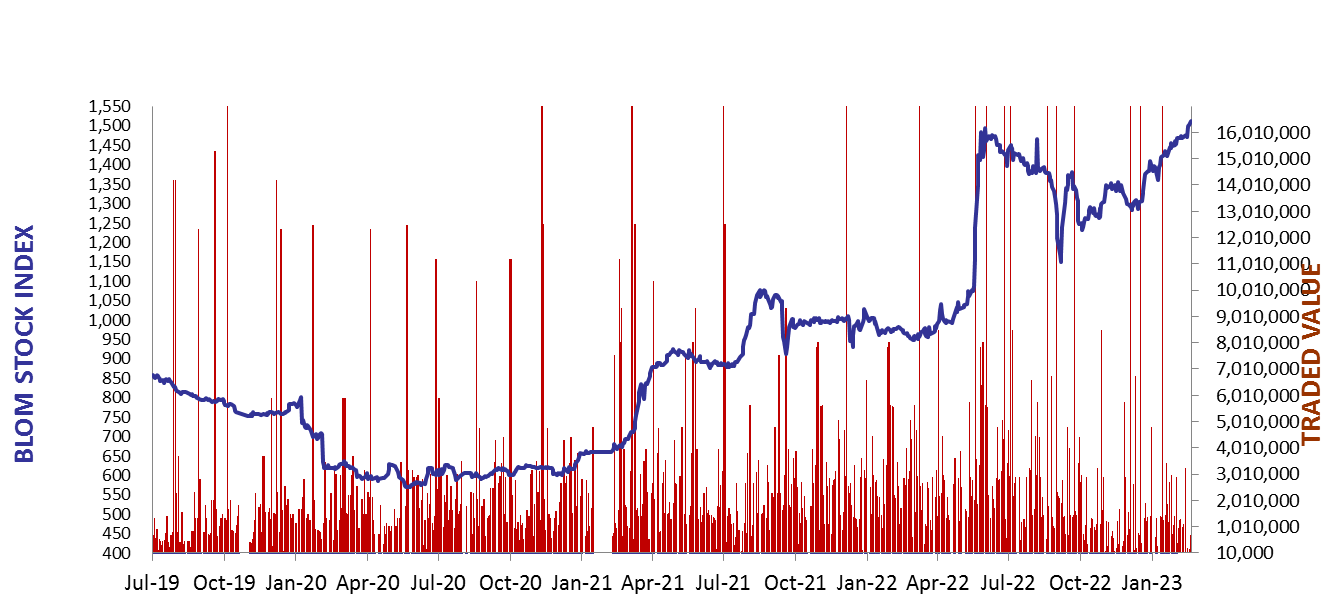
BLOM Stock Index (BSI) – today’s performance
| Last | Previous | % Change | Y-t-D Change | |
| BSI | 1,507.42 | 1,511.35 | -0.26% | 8.92% |
| High | 1,512.24 | 1,512.24 | ||
| Low | 1,507.42 | 1,507.85 | ||
| Volume | 292 | 4,132 | ||
| Val ($) | 19,361 | 279,954 |
I): BLOM preferred Shares Index (BPSI): today’s Performance
| Last | Previous | Change | |
| BPSI | 41.01 | 41.01 | 0.00% |
| Volume | |||
| Value |
Lebanese Stocks: today’s Trades and Closing Prices
| Last Price ($) | % Change | Volume | VWAP ($) | |
| Solidere A | 66.7 | -1.69% | 62 | 66.7 |
| Solidere B | 66.2 | 1.77% | 230 | 66.2 |
Closing Date: February 21, 2023
The BLOM Stock Index
| Last | Previous | Change | Y-t-D Change | ||
| BBI | 7.32 | 7.33 | -0.17% | 21.40% | |
| Weighted Yield | 156.63% | 155.82% | 81 | bps | |
| Duration (Years) | 1.36 | 1.37 | |||
| 5Y Bond Yield | 125.35% | 125.15% | 20 | bps | |
| 5Y Spread* | 12,035 | 12,015 | 20 | bps | |
| 10Y Bond Yield | 98.45% | 98.20% | 25 | bps | |
| 10Y Spread* | 9,412 | 9,387 | 25 | bps |
BLOM BOND INDEX: Last Session’s Performance
| Price | Yield | Yield Change | |
| 22/04/2024 | 7.03 | 458.20% | 492 |
| 04/11/2024 | 7.05 | 275.07% | 216 |
| 03/12/2024 | 7.04 | 265.67% | 146 |
| 26/02/2025 | 7.06 | 230.63% | 148 |
| 12/06/2025 | 7.29 | 192.63% | 133 |
| 28/11/2026 | 7.04 | 130.06% | 83 |
| 23/03/2027 | 7.09 | 125.41% | 12 |
| 29/11/2027 | 7.08 | 113.15% | 8 |
| 03/11/2028 | 7.08 | 103.28% | 17 |
| 26/02/2030 | 7.05 | 98.76% | 5 |
| 22/04/2031 | 7.01 | 99.35% | 19 |
| 23/03/2032 | 7.06 | 98.49% | 10 |
| 02/11/2035 | 7.10 | 97.01% | 6 |
| 23/03/2037 | 7.07 | 100.94% | 30 |
*spread between Lebanese Eurobonds and US Treasuries
Closing Date: February 20, 2023
Lebanese Forex Market
| Last Price | Previous | % Change | Y-t-D | |
| $/LBP | 1,514.25 | 1,514.25 | – | |
| €/LBP | 1,606.39 | 1,610.91 | -0.28% | |
| £/LBP | 1,823.47 | 1,815.18 | 0.46% | |
| NEER | 116.72 | 116.60 | 0.10% |
Closing Date: February 21, 2023