
Source: BDL; CAS; and Blominvest Bank
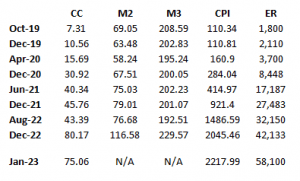
We start with clarifying the variables in the tables above. CC is currency in circulation; M2 is CC plus LBP deposits; M3 is M2 plus USD deposits; and all in trillion LBP. CPI is the consumer price index, with 2013 as the base year of 100; and ER is the average market exchange rate in LBP. Four dates are quite relevant: April 2020, when Circular 151 was issued; June 2021, when Circular 158 was issued; and December 2021, when Circular 161 (Sayarfa Platform) was fully activated; and August 2022, when the 3-fold increase in public wages was decreed by parliament.
Looking carefully into the above tables, we can derive the following observations:
1) CC witnessed the biggest increase, especially from April 2020 to December 2020, rising to 30.92 Tn LBP because of Circular 151; and from August 2022 to December 2022, rising to 80.17 Tn LBP because of the increase in public wages. Whereas M2 and M3 stayed more or less the same up to 2021, as the increase in CC was met by corresponding decreases in deposits; only in 2022 did they notably increase due to the big jump in CC.
2) Sayrafa was introduced to both absorb liquidity (CC) and retard the depreciations in the market exchange rate. It did an excellent job of that up to August 2022, as all CC, M2, and M3 actually fell, and ER rose at a slower rate to 32,150 LBP. But the 3-fold increase in public wages led by end 2022 to both the huge rise in CC to 80.17 Tn LBP and the depreciation in the ER to 42,133 LBP. BDL, against its better instincts, had to print money to fund this wage increase as government revenue was not forthcoming. But that experience was sobering enough for MOF, as it induced it to take new fiscal measures so as to enhance revenue, such as valuing customs duties at the higher rate of 15,000 LBP in addition to the taxing of USD wages.
3) That BDL’s control of CC was effective under the difficult circumstances can also be seen from the January 2023 data. BDL managed to reduce liquidity in that month, but unfortunately ER rose to a whopping 58,100 LBP. But that wasn’t BDL’s fault, as ER followed a dynamic of its own from the beginning of the year onward, driven by speculation and, more important, the severe political uncertainty of not electing a president.
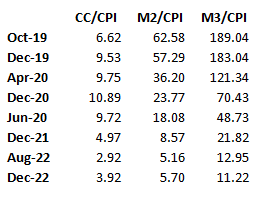
4) In fact, one could argue that BDL’s monetary policy – and perhaps as it should be – was fairly restrictive throughout the crisis. This can be seen from the values of the real monetary aggregates (as deflated by CPI) that fell to negligible levels by end 2022 – 3.92 Tn LBP for CC, 5.70 Tn LBP for M2, and 11.22 Tn LBP for M3. BDL could have accommodated the higher price levels by printing more money, but it largely avoided that so as not to ignite a vicious spiral of more money causing higher prices and so on.
5) What also triggers the higher prices/ER depreciations cycle is the higher velocity of money that usually takes place during inflationary times: not only we have more money changing fewer goods, but the money keeps running faster and faster. From the equation of exchange, we know that MV = PQ; where M is money (M2), V is velocity of money; P is the price level; and Q is real output. This also implies that:
(1) (% change in M) + (% change in V) = (% change in P) + (% change in Q)
Given that in 2022 the % change in M was 47.5%, % change in P was 121.9%, and % change in Q was -7.4%[1], then from (1) the % change in V was a significant 74%.
6) Lastly, over the period October 2019 to December 2022, the market exchange rate depreciated by 2240.7% but the price level rose by 1753.8%. This implies a pass-through coefficient from lower exchange rates to higher prices of 78% (1753.8/2240.7). By international standards, a pass-through coefficient of such magnitude is considered quite high[2], signifying a degree of imperfection/exploitation in the market for goods and services.
In conclusion, besides using its FX reserves to stabilize the exchange rate especially early in the crisis, BDL has followed mostly a sound, restrictive monetary policy to control liquidity and consequently its impact on exchange rate depreciations and prices. But BDL is alone in swimming against the tide, as forces beyond its control – deficit monetization, speculation, political uncertainty, imperfect competition, and faster money velocity – lean with the tide, frustrating its efforts and creating more havoc. It should at least be given this credit!
[1] This figure is from World Bank.
[2] Usually, the coefficient should not exceed the ratio of imports of goods and services to GDP.