
According to Lebanese customs, Lebanon’s trade deficit shrunk by a yearly 21% to reach $5.83B by May 2015. The smaller deficit came about as both imports and exports posted yearly declines of 19% and 8% to reach $7.1B and $1.27B in the first five months of 2015, respectively. The exports to imports ratio improved from 16% by May 2014 to 18% by May 2015.
By May 2015, the top import categories were “mineral products” with a share of 16.7% in the total value of imports, “machinery and electrical instruments” with a share of 11.8%, “products of the chemical or allied industries” with a stake of 11.5%, “vehicles, aircraft, vessels and transport equipment” with a share of 9% and “prepared foodstuffs, beverages, tobacco” with a share of 7.8%.
By May 2015, imports of mineral products slumped by 43% year-on-year (y-o-y) to $1.19B, imports of machinery and electrical instruments fell by 15% y-o-y to $837.34M, imports of products of the chemical or allied industries dropped by 5% y-o-y to $818.14M and imports of prepared foodstuffs, beverages and tobacco slid by 6% y-o-y to $550.35M. The only exception to the downward trend were the imports of vehicles, aircrafts, vessels and transport equipment which grew by 7% y-o-y to reach $636.19M by May 2015.
In the first five months of 2015, the top export categories were “prepared foodstuffs, beverages, tobacco” with a share of 16.17% in the total value of exports, “pearls, precious stones and metals” with a share of 16%, “products of the chemical or allied industries” with a share of 14.07%, “machinery and electrical instruments” with a share of 13.83% and “base metals and articles of base metals” with a share of 10.81%.
The exports of prepared foodstuffs, beverages, and tobacco fell by 6.65% y-o-y to $205.67M, the exports of pearls, precious stones and metals declined by 21.70% y-o-y to $203.47M, the exports of machinery and electrical instruments shrunk by 6.77% y-o-y to $175.9M and exports of base metals and articles of base metals contracted by 15.45% to $137.51M.
By May 2015, the top import destinations were China, Italy, Germany and France with stakes of 11.6%, 7%, 6.6% and 5.9% in total imports.
As for the top markets for Lebanese exports by May 2015, they were Saudi Arabia, the UAE, Iraq, South Africa and Syria with respective share of 13%, 11%, 8%, 7% and 6%, respectively.
Lebanon’s Trade Balance Figures, By May of each year (In Thousands of USD)
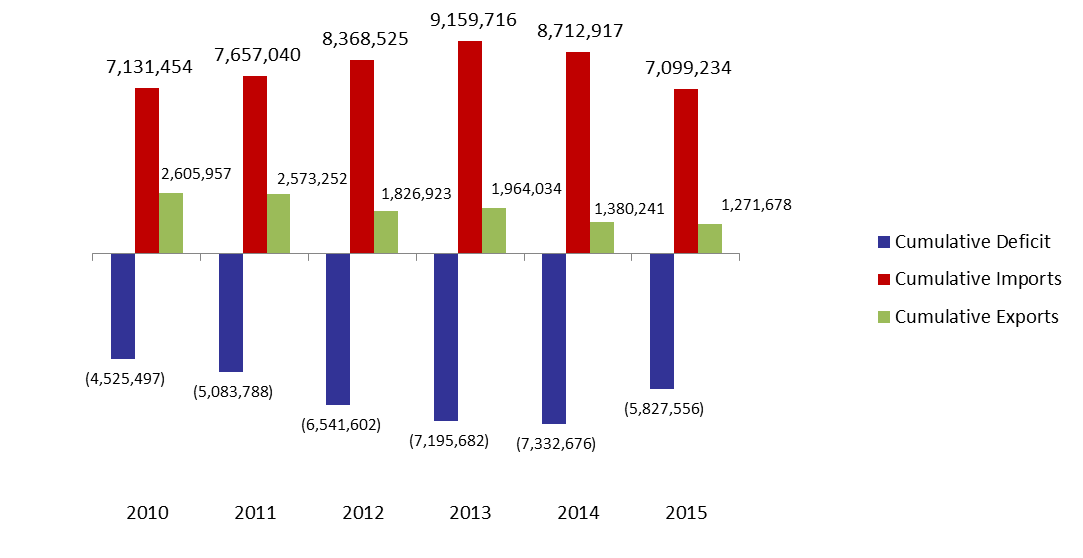
Source: Lebanese Customs