
Discover today’s performance of BLOM indices, the closing prices of Lebanese stocks and Eurobonds, as well as the exchange rate of major currencies against the LBP.
BLOM Stock Index (BSI): Today’s Performance
| Last | Previous | % Change | Y-t-D Change | |
| BSI | 1,146.94 | 1,150.42 | -0.302% | -5.42% |
| High | 1,150.28 | 1,150.76 | ||
| Low | 1,143.99 | 1,148.44 | ||
| Volume | 37,975 | 112,897 | -66.36% | |
| Val ($) | 469,076 | 1,136,720 | -58.73% |
BLOM Preferred Shares Index (BPSI): Today’s Performance
| Last | Previous | Change | |
| BPSI | 105.39 | 105.27 | 0.11% |
| Volume | 2,172 | 4,500 | |
| Value | 220,273 | 160,125 |
Lebanese Stocks: Today’s Trades and Closing Prices
| Last Price ($) | % Change | Volume | VWAP ($) | |
| Solidere A | 7.96 | -0.38% | 18,262 | 7.93 |
| Solidere B | 7.83 | -1.51% | 1,475 | 7.83 |
| Bank Audi | 5.87 | -1.34% | 8,200 | 5.87 |
| Bank Audi GDR | 5.95 | -0.83% | 5,000 | 5.95 |
| Bank Audi Pref G | 101 | 0.50% | 200 | 101 |
| Bank Audi Pref H | 101.2 | – | 625 | 101.2 |
| Bank Audi Pref I | 101.5 | 0.30% | 1,200 | 101.5 |
| Byblos Bank | 1.6 | – | 2,000 | 1.6 |
| Byblos Bank Preferred 2009 | 1022.2 | 0.10% | 147 | 1022.2 |
| HOLCIM | 13.21 | 3.53% | 866 | 13.21 |
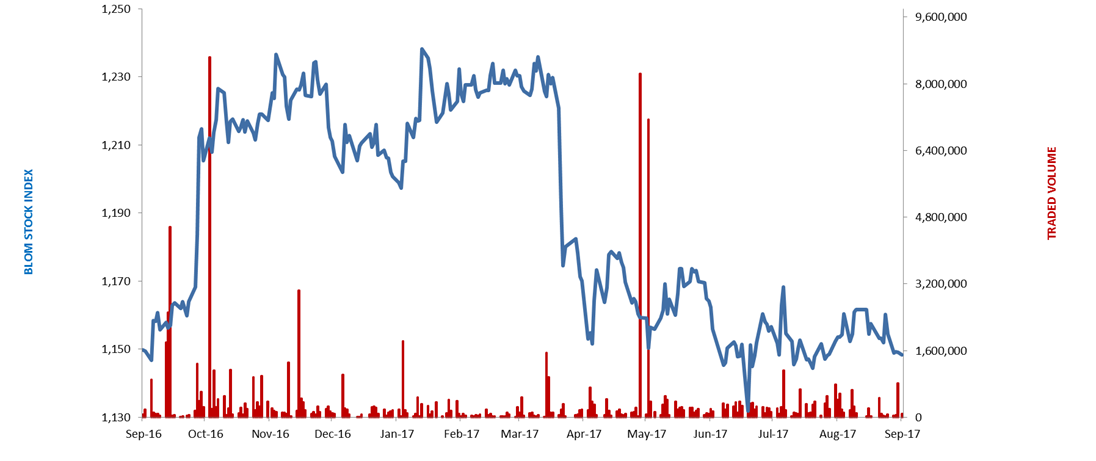
The BLOM Stock Index
Lebanese Global Depository Receipts: Last session’s Performance
| GDRs | Last Price ($) | Previous Price ($) | % Change | Volume | Value ($) |
| BLOM GDR | 12.5 | 12.45 | 0.4% | 22,467 | 143,289 |
| Audi GDR | 5.99 | 5.99 | 0.0% | – | – |
| Byblos GDR | 80 | 80 | 0.0% | – | – |
Source: London Stock Exchange
Closing Date: 25 Sept 2017
BLOM BOND INDEX: Last Session’s Performance
| Last | Previous | Change | Y-t-D Change | ||
| BBI | 103.99 | 104.43 | -0.42% | 2.05% | |
| Weighted Yield | 6.284% | 6.199% | 9 | bps | |
| Duration (Years) | 5.21 | 5.19 | |||
| 5Y Bond Yield | 6.15% | 6.10% | 5 | bps | |
| 5Y Spread* | 430 | 422 | 8 | bps | |
| 10Y Bond Yield | 6.88% | 6.79% | 9 | bps | |
| 10Y Spread* | 466 | 453 | 13 | bps | |
*between Lebanese Eurobonds and US Treasuries
Closing Date: 25 September 2017
Lebanese Eurobonds: Last Sessions’ Prices and Yields
| Price | Yield | Yield Change | |
| 12/11/2018 | 100.50 | 4.69% | 0 |
| 23/04/2019 | 100.50 | 5.16% | 25 |
| 20/05/2019 | 101.25 | 5.20% | 23 |
| 28/11/2019 | 100.25 | 5.32% | 24 |
| 09/03/2020 | 102.00 | 5.49% | 10 |
| 14/04/2020 | 100.50 | 5.59% | 4 |
| 19/06/2020 | 101.13 | 5.69% | 5 |
| 12/04/2021 | 107.75 | 5.80% | 3 |
| 04/10/2022 | 99.63 | 6.19% | 6 |
| 27/01/2023 | 98.50 | 6.33% | 6 |
| 22/04/2024 | 100.25 | 6.60% | 14 |
| 04/11/2024 | 98.00 | 6.61% | 11 |
| 03/12/2024 | 102.00 | 6.64% | 13 |
| 26/02/2025 | 97.38 | 6.65% | 9 |
| 12/06/2025 | 97.38 | 6.69% | 9 |
| 28/11/2026 | 98.75 | 6.78% | 7 |
| 23/03/2027 | 100.00 | 6.85% | 7 |
| 29/11/2027 | 99.00 | 6.89% | 9 |
| 03/11/2028 | 97.13 | 7.03% | 12 |
| 26/02/2030 | 96.75 | 7.05% | 8 |
| 22/04/2031 | 99.00 | 7.12% | 3 |
| 23/03/2032 | 98.38 | 7.18% | 7 |
| 02/11/2035 | 97.75 | 7.27% | 6 |
| 23/03/2037 | 97.88 | 7.46% | 9 |
| Last Price | Previous | % Change | Y-t-D | |
| $/LBP | 1,514.00 | 1,514.00 | – | |
| €/LBP | 1,777.95 | 1,801.16 | -1.29% | |
| £/LBP | 2,026.53 | 2,034.37 | -0.39% | |
| NEER | 111.59 | 111.21 | 0.34% | -5.76% |
Closing Date: 26 September 2017