
Main Banking Indicators, June 2024
Association of Banks in Lebanon (ABL) revealed some figures regarding banking and monetary indicators as of end of June 2024. These indicators reveal the effects of the banking sector crisis in Lebanon, where banks branches and employees decreased significantly between December 2019 and December 2023, in addition to the decrease in deposits and loans in LBP and USD between end of September 2019 (just before the blow of the financial and banking sector crisis) and end of June 2024. These changes are detailed in the below tables.
Table 1: Number of Banks’ Branches and Employees
| Dec-19 | Dec-23 | % Change | |
| Number of Branches | 1,058 | 695 | -34.31% |
| Number of Employees | 24,704 | 14,693 | -40.52% |
Source: ABL
Table 1 above shows the decrease in number of branches and employees where number of branches decreased by 34.31% to reach 695 in December 2023 and number of employees declined by 40.52% to 14,693.
Table 2: Comparison of LBP Private Sector Loans and Deposits between September 2019 & June 2024
| In billions of LBP | Sep-19 | Jun-24 | % Change |
| Private Sector Deposits | 69,592 | 62,713 | -9.88% |
| Private Sector Loans | 24,429 | 11,185 | -54.21% |
| % of Private Sector Loans to Deposits | 35.10% | 17.84% |
Source: ABL
Table 2 above shows a decrease in private sector deposits by 9.88% between September 2019 and June 2024. Similarly, private sector loans decreased significantly by 54.21% mainly due to the settlement of most of the loans after deterioration of LBP that made loans in LBP cheap compared to USD in the parallel market. Therefore, many people exchanged some of their USD savings and settled there LBP loans.
Table 3: Comparison of USD Private Sector Loans and Deposits between September 2019 & June 2024
| In millions of USD | Sep-19 | Jun-24 | % Change |
| Private Sector Deposits | 124,138 | 90,092 | -27.43% |
| Private Sector Loans | 38,296 | 6,693 | -82.52% |
| % of Private Sector Loans to Deposits | 30.85% | 7.43% |
Source: ABL
Table 3 reveals that 30.85% of private sector deposits were granted as loans to the private sector. Between September 2019 and June 2024, we notice the substantial decline in which loans decreased by USD 31.6 billion. As for deposits, a noteworthy decrease was noticed ($34 billion) and most of it must have been used to settle loans through checks. As a result, the ratio of loans to deposits in USD fell to 7.43%.
Table 4: Banks’ Claims and Liabilities at Correspondent Banks
| In millions of USD | Sep-19 | Jun-24 | % Change |
| Claims on Non-resident Financial Sector | 8,976 | 4,407 | -50.90% |
| Non-resident Financial Sector Liabilities | 9,661 | 2,655 | -72.52% |
Table 4 shows that in September 2019, non-resident financial sector liabilities (banks’ liabilities at correspondent banks) exceeded the claims on non-resident financial sector (banks’ deposits at correspondent banks). It is to be noted that starting January 2023, claims on non-resident financial sector became larger than non-resident financial sector liabilities. As of June 2024, claims on non-resident financial sector and non-resident financial sector liabilities recorded USD 4.4 billion & USD 2.66 billion respectively.
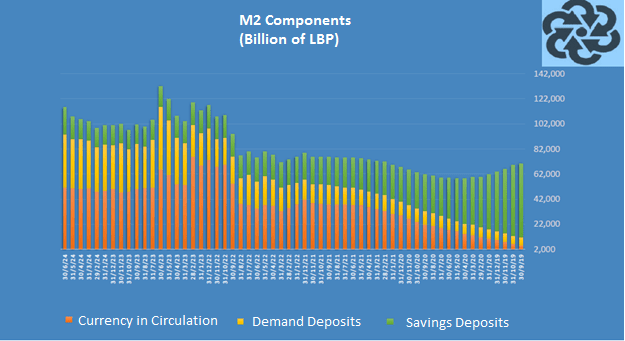
It is interesting to examine the components of M2, being currency in circulation, demand deposits in LBP, and savings in LBP and its change through the crisis. The graph below shows the detailed components of M2.
Source: ABL
Before the crisis, savings was the main component of M2, however, at the end of June 2024, currency in circulation became the main component of M2, followed by demand deposits, and then savings became the least component.
Disclaimer :
This article is a research document that is owned and published by Blominvest Bank SAL.
No material from this publication may be modified, copied, reproduced, repackaged, republished, circulated, transmitted or redistributed directly or indirectly, in whole or in any part, without the prior written authorization of Blominvest Bank SAL.
The information and opinions contained in this document have been compiled from or arrived at in good faith from sources deemed reliable. Neither Blominvest Bank SAL, nor any of its subsidiaries or affiliates or parent company will make any representation or warranty to the accuracy or completeness of the information contained herein.
Neither the information nor any opinion expressed in this research article constitutes an offer or a recommendation to buy or sell any assets or securities, or to provide investment advice.
This research article is prepared for general circulation and is circulated for general information only.