
Discover today’s performance of BLOM indices, the closing prices of Lebanese stocks and Eurobonds, as well as the exchange rate of major currencies against the LBP.
BLOM Stock Index (BSI): Today’s Performance
| Last | Previous | % Change | Y-t-D Change | |
| BSI | 1,118.18 | 1,122.81 | -0.41% | -2.65% |
| High | 1,120.54 | 1,125.81 | ||
| Low | 1,116.89 | 1,122.35 | ||
| Volume | 188,903 | 57,139 | 230.60% | |
| Val ($) | 1,917,861 | 488,723 | 292.42% |
BLOM preferred Shares Index (BPSI): Today’s Performance
| Last | Previous | Change | |
| BPSI | 100.81 | 101.70 | -0.88% |
| Volume | 3,833 | 500 | |
| Value | 254,368 | 48,475 |
Lebanese Stocks: Today’s Trades and Closing Prices
| Last Price ($) | % Change | Volume | VWAP ($) | |
| Solidere A | 8.47 | -0.70% | 11,388 | 8.47 |
| Solidere B | 8.5 | 1.55% | 5,480 | 8.5 |
| Bank Audi Listed Shares | 5.6 | -2.43% | 5,000 | 5.6 |
| Bank Audi GDR | 5.69 | – | 6,000 | 5.69 |
| Bank of Beirut Preferred I | 25 | -3.84% | 1,600 | 25 |
| Byblos Listed shares | 1.5 | 2.04% | 30,000 | 1.5 |
| Byblos Pref 2009 | 96 | -0.97% | 2,233 | 96 |
| Blom Listed Shares | 11 | – | 100,000 | 11 |
| BLOM GDR | 11.22 | -0.26% | 25,202 | 11.22 |
| Holcim | 15.5 | – | 2,000 | 15.5 |
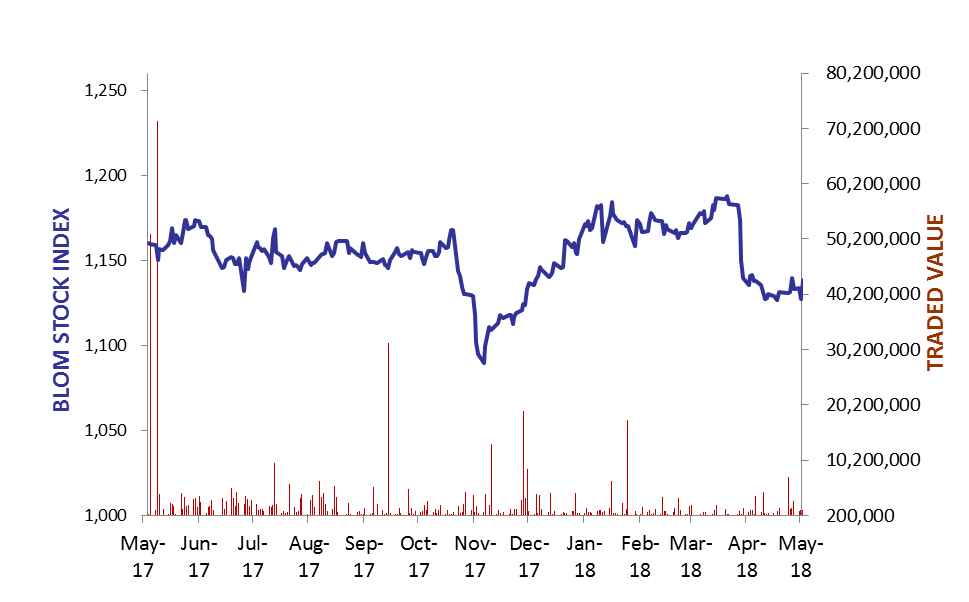
The BLOM Stock Index
Lebanese Global Depository Receipts: Last session’s Performance
| GDRs | Last Price ($) | Previous Price ($) | % Change | Volume | Value ($) |
| BLOM GDR | 11.2 | 11.2 | 0.0% | – | – |
| Audi GDR | 5.6 | 5.6 | 0.0% | – | – |
| Byblos GDR | 75 | 75 | 0.0% | – | – |
Source: London Stock Exchange
Closing Date: 24 May 2018
BLOM BOND INDEX: Last Session’s Performance
| Last | Previous | Change | Y-t-D Change | ||
| BBI | 94.54 | 93.15 | 1.50% | -6.45% | |
| Weighted Yield | 8.37% | 8.80% | -42 | bps | |
| Duration (Years) | 4.83 | 4.81 | |||
| 5Y Bond Yield | 8.24% | 8.60% | -36 | bps | |
| 5Y Spread* | 542 | 577 | -35 | bps | |
| 10Y Bond Yield | 9.00% | 9.32% | -32 | bps | |
| 10Y Spread* | 602 | 631 | -29 | bps | |
*between Lebanese Eurobonds and US Treasuries
Closing Date: 24 May 2018
Lebanese Eurobonds: Last Sessions’ Prices and Yields
| Price | Yield | Yield Change | |
| 23/04/2019 | 98.75 | 6.93% | -87 |
| 20/05/2019 | 99.13 | 6.92% | -94 |
| 28/11/2019 | 97.63 | 7.13% | -82 |
| 09/03/2020 | 98.25 | 7.43% | -77 |
| 14/04/2020 | 97.00 | 7.53% | -74 |
| 19/06/2020 | 97.25 | 7.61% | -74 |
| 12/04/2021 | 100.38 | 8.09% | -45 |
| 04/10/2022 | 92.13 | 8.28% | -33 |
| 27/01/2023 | 90.88 | 8.40% | -32 |
| 22/04/2024 | 90.50 | 8.74% | -20 |
| 04/11/2024 | 87.75 | 8.78% | -19 |
| 03/12/2024 | 91.25 | 8.79% | -22 |
| 26/02/2025 | 86.88 | 8.82% | -22 |
| 12/06/2025 | 86.50 | 8.86% | -21 |
| 28/11/2026 | 86.00 | 8.99% | -28 |
| 23/03/2027 | 87.13 | 8.99% | -35 |
| 29/11/2027 | 85.88 | 8.99% | -33 |
| 03/11/2028 | 84.38 | 8.99% | -30 |
| 26/02/2030 | 83.25 | 8.98% | -28 |
| 22/04/2031 | 84.88 | 9.00% | -22 |
| 23/03/2032 | 84.75 | 8.94% | -29 |
| 02/11/2035 | 83.13 | 8.98% | -22 |
| 23/03/2037 | 84.25 | 9.00% | -19 |
| Last Price | Previous | % Change | Y-t-D | |
| $/LBP | 1,514.25 | 1,514.25 | – | |
| €/LBP | 1,754.58 | 1,757.14 | -0.15% | |
| £/LBP | 2,006.93 | 2,008.14 | -0.06% | |
| NEER | 113.88 | 113.82 | 0.05% | 2.67% |
Closing Date: 28 May 2018