
Discover today’s performance of BLOM indices, the closing prices of Lebanese stocks and Eurobonds, as well as the exchange rate of major currencies against the LBP.
BLOM Stock Index (BSI) – today’s performance
| Last | Previous | % Change | Y-t-D Change | |
| BSI | 1,758.45 | 1,812.84 | -3.00% | 27.06% |
| High | 1,812.84 | 1,813.87 | ||
| Low | 1,750.45 | 1,762.25 | ||
| Volume | 864,818 | 12,420 | ||
| Val ($) | 64,861,068 | 560,949 |
I): BLOM preferred Shares Index (BPSI): today’s Performance
| Last | Previous | Change | |
| BPSI | 39.62 | 39.62 | 0.00% |
| Volume | |||
| Value |
Lebanese Stocks: today’s Trades and Closing Prices
| Last Price ($) | % Change | Volume | VWAP ($) | |
| Solidere A | 75.05 | -3.41% | 7,700 | 75.07 |
| Solidere B | 74.8 | -5.67% | 857,118 | 75 |
Closing Date: December 15, 2023
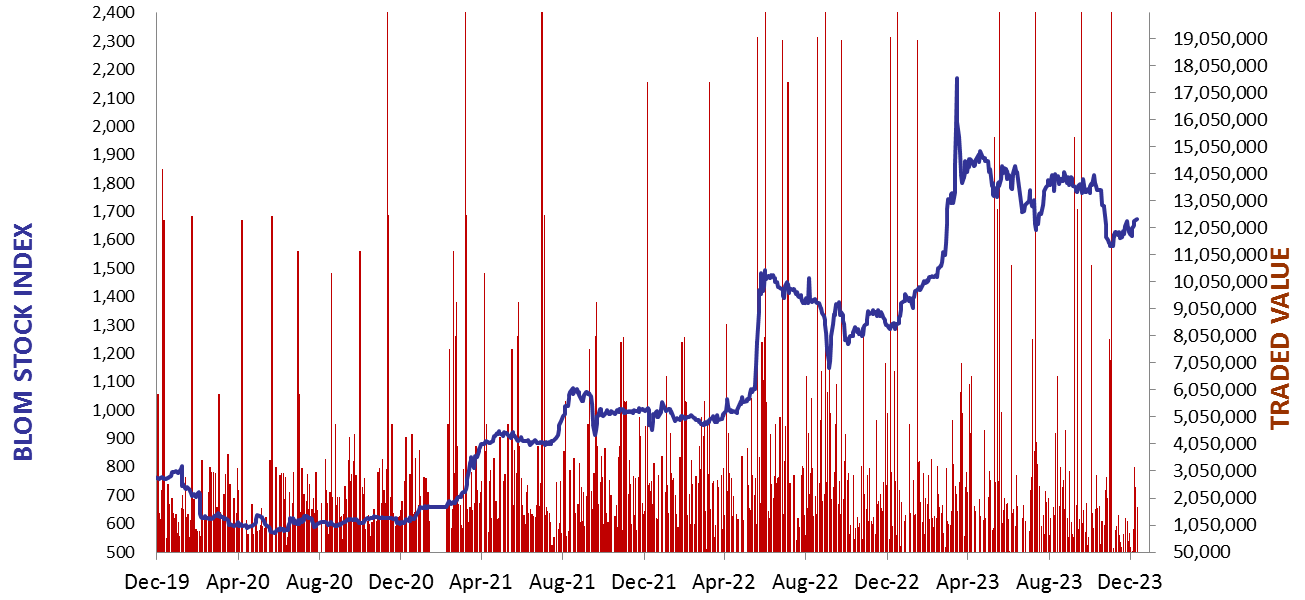
The BLOM Stock Index
BLOM BOND INDEX: Last Session’s Performance
| Last | Previous | Change | Y-t-D Change | ||
| BBI | 5.80 | 5.79 | 0.16% | -3.88% | |
| Weighted Yield | 225.68% | 225.52% | 16 | bps | |
| Duration (Years) | 1.35 | 1.36 | |||
| 5Y Bond Yield | 161.30% | 161.70% | -40 | bps | |
| 5Y Spread* | 15,640 | 15,676 | -36 | bps | |
| 10Y Bond Yield | 114.60% | 115.05% | -45 | bps | |
| 10Y Spread* | 11,051 | 11,087 | -36 | bps |
*spread between Lebanese Eurobonds and US Treasuries
| Price | Yield | Yield Change | |
| 04/11/2024 | 5.89 | 818.98% | 619 |
| 03/12/2024 | 6.04 | 716.30% | (23) |
| 26/02/2025 | 5.99 | 483.62% | (166) |
| 12/06/2025 | 6.16 | 363.31% | 82 |
| 28/11/2026 | 5.89 | 177.61% | 53 |
| 23/03/2027 | 5.98 | 161.42% | (58) |
| 29/11/2027 | 5.96 | 143.42% | 5 |
| 03/11/2028 | 5.97 | 125.60% | (52) |
| 26/02/2030 | 5.96 | 114.65% | 4 |
| 22/04/2031 | 5.94 | 116.90% | (17) |
| 23/03/2032 | 5.98 | 114.42% | (51) |
| 02/11/2035 | 5.98 | 115.28% | (36) |
| 23/03/2037 | 5.93 | 118.15% | 25 |
Closing Date: December 14, 2023
Lebanese Forex Market
| Last Price | Previous | % Change | |
| $/LBP | 15,000 | 15,000 | – |
| €/LBP | 16,477.50 | 16,489.50 | -0.07% |
| £/LBP | 19,141.50 | 19,150.50 | -0.05% |
| NEER | 240.17 | 240.35 | -0.07% |
Closing Date: December 15, 2023