
Discover today’s performance of BLOM indices, the closing prices of Lebanese stocks and Eurobonds, as well as the exchange rate of major currencies against the LBP.
BLOM Stock Index (BSI) – today’s performance
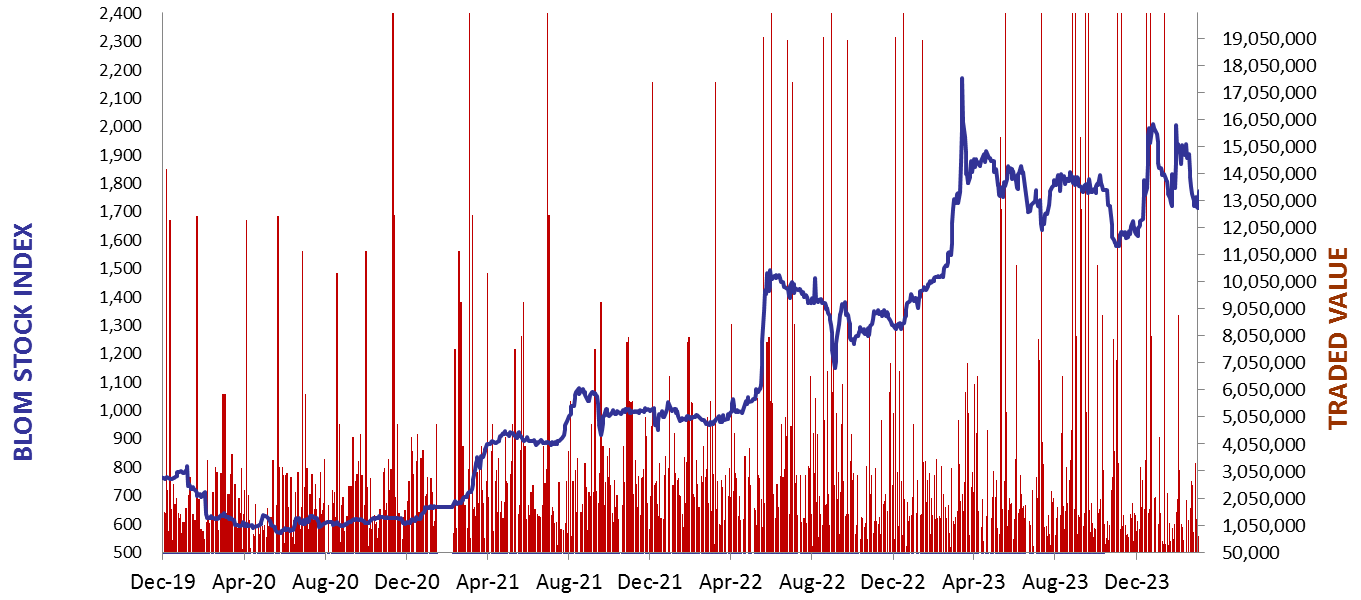
| Last | Previous | % Change | Y-t-D Change | |
| BSI | 1,619.70 | 1,617.60 | 0.13% | -17.91% |
| High | 1,622.69 | 1,640.88 | ||
| Low | 1,611.92 | 1,610.10 | ||
| Volume | 15,975 | 40,153 | ||
| Val ($) | 1,113,638 | 2,253,502 |
I): BLOM preferred Shares Index (BPSI): today’s Performance
| Last | Previous | Change | |
| BPSI | 35.15 | 35.15 | 0.00% |
| Volume | |||
| Value |
Lebanese Stocks: today’s Trades and Closing Prices
| Last Price ($) | % Change | Volume | VWAP ($) | |
| Solidere A | 70.75 | 1.14% | 14,975 | 70.01 |
| Solidere B | 65.25 | -1.36% | 1,000 | 65.25 |
Closing Date: May 15, 2024
The BLOM Stock Index
BLOM BOND INDEX: Last Session’s Performance
| Last | Previous | Change | Y-t-D Change | ||
| BBI | 6.15 | 6.15 | -0.01% | 2.01% | |
| Weighted Yield | 229.26% | 228.52% | 73 | bps | |
| Duration (Years) | 1.35 | 1.35 | |||
| 5Y Bond Yield | 106.05% | 106.05% | 0 | bps | |
| 5Y Spread* | 10,089 | 10,089 | 0 | bps | |
| 10Y Bond Yield | 103.85% | 103.90% | -5 | bps | |
| 10Y Spread* | 9,923 | 9,924 | -1 | bps |
*spread between Lebanese Eurobonds and US Treasuries
| Price | Yield | Yield Change | |
| 26/02/2025 | 6.80 | 916.55% | 580 |
| 12/06/2025 | 6.97 | 528.66% | 246 |
| 28/11/2026 | 6.80 | 187.42% | 28 |
| 23/03/2027 | 6.79 | 168.38% | 9 |
| 29/11/2027 | 6.79 | 142.31% | 13 |
| 03/11/2028 | 6.79 | 121.53% | (1) |
| 26/02/2030 | 6.78 | 106.08% | 7 |
| 22/04/2031 | 6.79 | 105.92% | (3) |
| 23/03/2032 | 6.79 | 102.99% | (2) |
| 02/11/2035 | 6.79 | 103.28% | (5) |
| 23/03/2037 | 6.85 | 103.64% | 0 |
Closing Date: May 14, 2024
Lebanese Forex Market
| Last Price | Previous | % Change | |
| $/LBP | 89,500 | 89,500 | – |
| €/LBP | 96,901.65 | 96,821.10 | 0.08% |
| £/LBP | 112,752.10 | 112,662.60 | 0.08% |
| NEER | 227.21 | 227.21 | 0.00% |
Closing Date: May 15, 2024