
Discover today’s performance of BLOM indices, the closing prices of Lebanese stocks and Eurobonds, as well as the exchange rate of major currencies against the LBP.
BLOM Stock Index (BSI) – today’s performance
| Last | Previous | % Change | Y-t-D Change | |
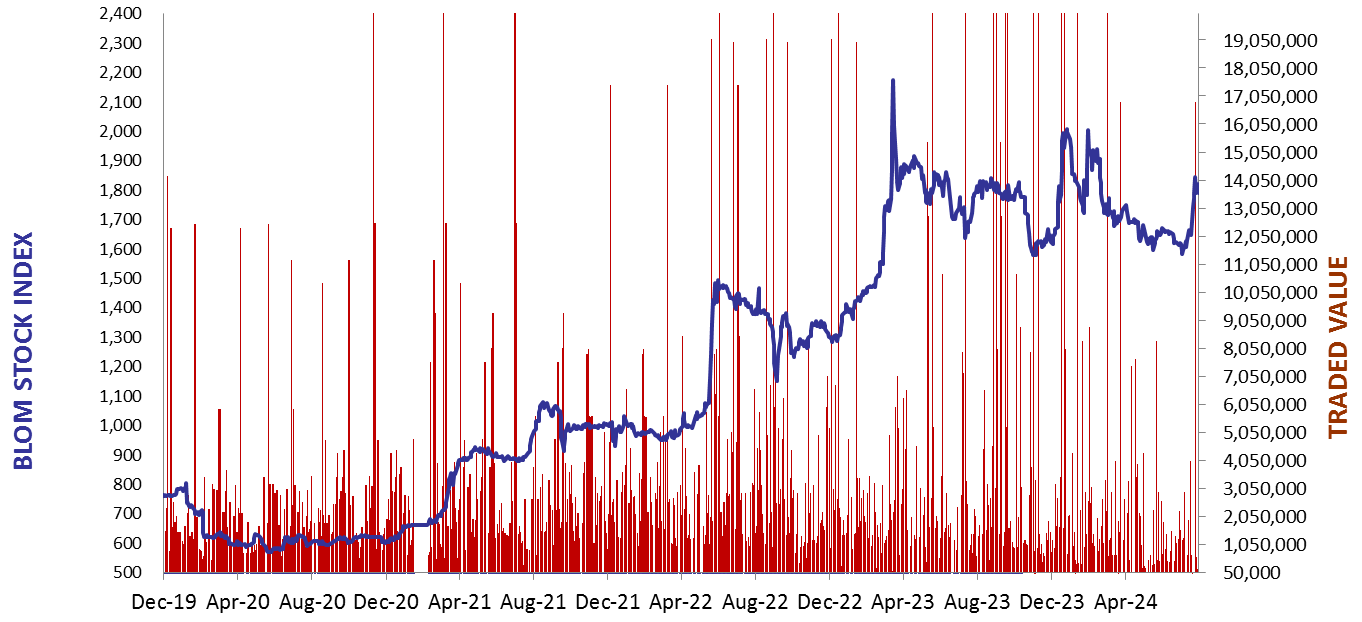
| BSI | 1,769.17 | 1,736.14 | 1.90% | -10.33% |
| High | 1,772.92 | 1,743.64 | ||
| Low | 1,736.14 | 1,731.91 | ||
| Volume | 5,526 | 2,122 | ||
| Val ($) | 420,418 | 163,674 |
I): BLOM preferred Shares Index (BPSI): today’s Performance
| Last | Previous | Change | |
| BPSI | 27.78 | 27.78 | 0.00% |
| Volume | |||
| Value |
Lebanese Stocks: today’s Trades and Closing Prices
| Last Price ($) | % Change | Volume | VWAP ($) | |
| Solidere A | 80.15 | 2.76% | 3,586 | 79.50 |
| Solidere B | 77.10 | 2.73% | 1,119 | 76.90 |
| HOLCIM | 60.00 | -0.83% | 821 | 60.00 |
Closing Date: August 20, 2024
The BLOM Stock Index
BLOM BOND INDEX: Last Session’s Performance
| Last | Previous | Change | Y-t-D Change | ||
| BBI | 5.88 | 5.87 | 0.10% | -2.51% | |
| Weighted Yield | 400.82% | 388.80% | 1203 | bps | |
| Duration (Years) | 1.18 | 1.19 | |||
| 5Y Bond Yield | 112.15% | 112.00% | 15 | bps | |
| 5Y Spread* | 10,767 | 10,751 | 16 | bps | |
| 10Y Bond Yield | 107.90% | 108.00% | -10 | bps | |
| 10Y Spread* | 10,404 | 10,413 | -9 | bps |
*spread between Lebanese Eurobonds and US Treasuries
| Price | Yield | Yield Change | |
| 26/02/2025 | 6.49 | 2589.33% | 13,229 |
| 12/06/2025 | 6.58 | 877.27% | 1,551 |
| 28/11/2026 | 6.52 | 210.53% | 33 |
| 23/03/2027 | 6.42 | 190.30% | 47 |
| 29/11/2027 | 6.50 | 152.75% | 22 |
| 03/11/2028 | 6.50 | 127.65% | 17 |
| 26/02/2030 | 6.50 | 113.34% | 22 |
| 22/04/2031 | 6.48 | 109.63% | (21) |
| 23/03/2032 | 6.54 | 107.31% | 13 |
| 02/11/2035 | 6.54 | 105.04% | 4 |
| 23/03/2037 | 6.53 | 109.00% | 26 |
Closing Date: August 19, 2024
Lebanese Forex Market
| Last Price | Previous | % Change | |
| $/LBP | 89,500 | 89,500 | – |
| €/LBP | 99,130.20 | 99,210.75 | -0.08% |
| £/LBP | 116,215.75 | 116,242.60 | -0.02% |
| NEER | 229.49 | 229.23 | 0.11% |
Closing Date: August 20, 2024