
Discover today’s performance of BLOM indices, the closing prices of Lebanese stocks and Eurobonds, as well as the exchange rate of major currencies against the LBP.
BLOM Stock Index (BSI) – today’s performance
| Last | Previous | % Change | Y-t-D Change | |
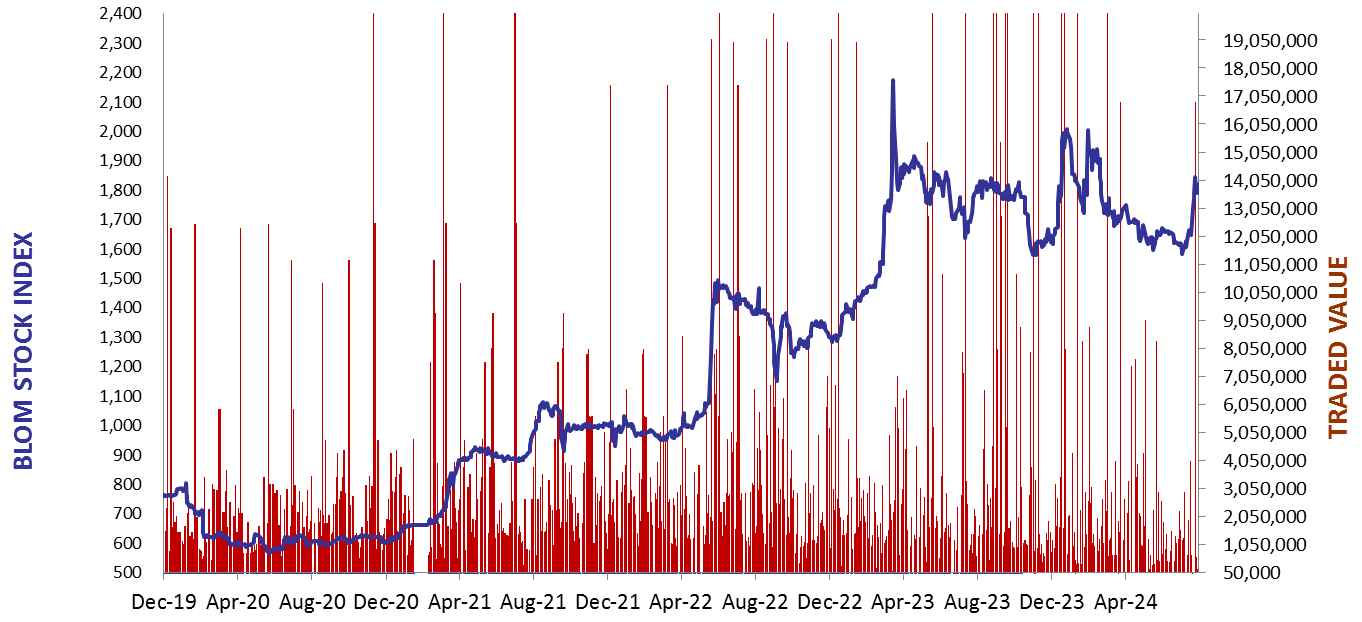
| BSI | 1,819.80 | 1,844.65 | -1.35% | -7.76% |
| High | 1,826.31 | 1,849.27 | ||
| Low | 1,811.47 | 1,836.53 | ||
| Volume | 2,154 | 21,482 | ||
| Val ($) | 175,505 | 1,224,391 |
I): BLOM preferred Shares Index (BPSI): today’s Performance
| Last | Previous | Change | |
| BPSI | 27.78 | 27.78 | 0.00% |
| Volume | |||
| Value |
Lebanese Stocks: today’s Trades and Closing Prices
| Last Price ($) | % Change | Volume | VWAP ($) | |
| Solidere A | 81.50 | -2.16% | 2,085 | 81.51 |
| Solidere B | 80.50 | -1.41% | 69 | 80.50 |
Closing Date: August 28, 2024
The BLOM Stock Index
BLOM BOND INDEX: Last Session’s Performance
| Last | Previous | Change | Y-t-D Change | ||
| BBI | 5.47 | 5.45 | 0.36% | -9.35% | |
| Weighted Yield | 213.53% | 213.49% | 4 | bps | |
| Duration (Years) | 1.32 | 1.32 | |||
| 5Y Bond Yield | 108.70% | 108.90% | -20 | bps | |
| 5Y Spread* | 10,436 | 10,452 | -16 | bps | |
| 10Y Bond Yield | 105.45% | 105.80% | -35 | bps | |
| 10Y Spread* | 10,173 | 10,206 | -33 | bps |
*spread between Lebanese Eurobonds and US Treasuries
| Price | Yield | Yield Change | |
| 12/06/2025 | 6.66 | 912.36% | 294 |
| 28/11/2026 | 6.55 | 211.99% | 42 |
| 23/03/2027 | 6.56 | 190.02% | 2 |
| 29/11/2027 | 6.56 | 152.76% | 14 |
| 03/11/2028 | 6.53 | 127.75% | (5) |
| 26/02/2030 | 6.53 | 113.43% | (18) |
| 22/04/2031 | 6.55 | 108.88% | (1) |
| 23/03/2032 | 6.63 | 106.39% | (119) |
| 02/11/2035 | 6.61 | 104.10% | (63) |
| 23/03/2037 | 6.62 | 107.96% | (125) |
Closing Date: August 27, 2024
Lebanese Forex Market
| Last Price | Previous | % Change | |
| $/LBP | 89,500 | 89,500 | – |
| €/LBP | 99,568.75 | 100,096.80 | -0.53% |
| £/LBP | 118,301.10 | 118,632.25 | -0.28% |
| NEER | 229.97 | 229.89 | 0.04% |
Closing Date: August 28, 2024