
Discover today’s performance of BLOM indices, the closing prices of Lebanese stocks and Eurobonds, as well as the exchange rate of major currencies against the LBP.
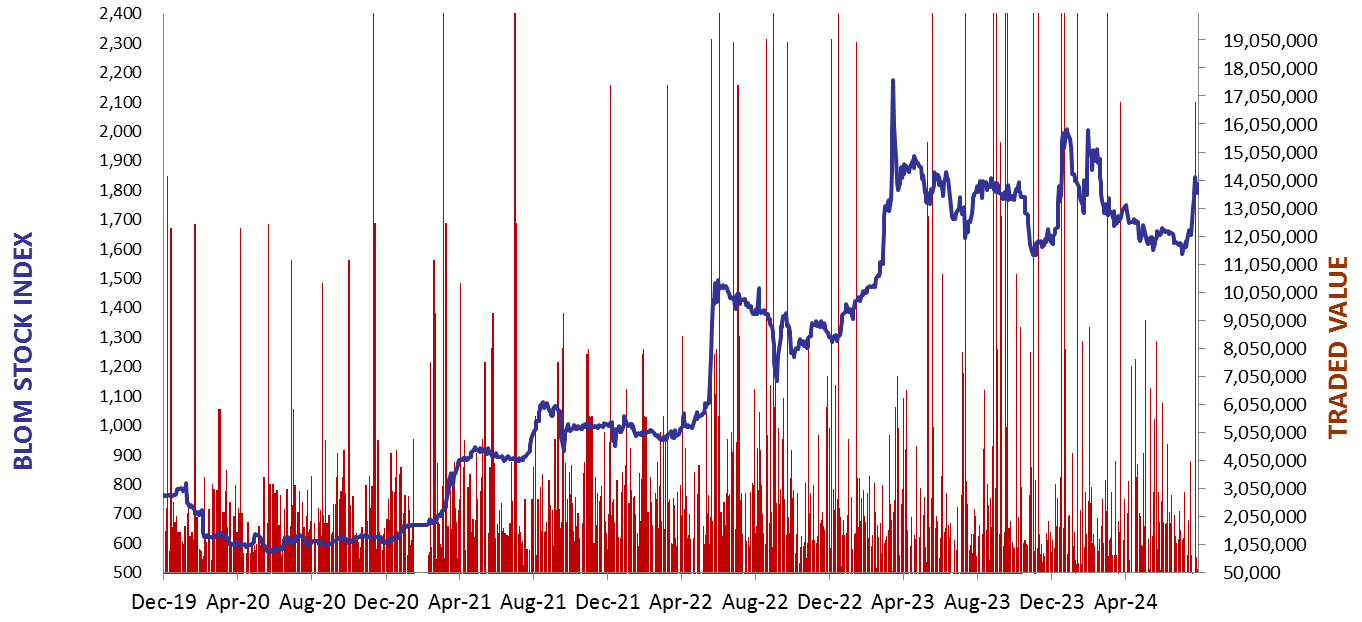
BLOM Stock Index (BSI) – today’s performance
| Last | Previous | % Change | Y-t-D Change | |
| BSI | 2,084.41 | 2,111.80 | -1.30% | 5.65% |
| High | 2,092.16 | 2,116.22 | ||
| Low | 2,075.63 | 2,096.40 | ||
| Volume | 27,251 | 55,615 | ||
| Val ($) | 2,093,675 | 2,797,586 |
I): BLOM preferred Shares Index (BPSI): today’s Performance
| Last | Previous | Change | |
| BPSI | 27.78 | 27.78 | 0.00% |
| Volume | |||
| Value |
Lebanese Stocks: today’s Trades and Closing Prices
| Last Price ($) | % Change | Volume | VWAP ($) | |
| Solidere A | 92.55 | -1.91% | 21,034 | 92.55 |
| Solidere B | 92.00 | -1.66% | 1,217 | 92.00 |
| BLOM – Listed Shares | 7.00 | 0.00% | 5,000 | 7.00 |
Closing Date: October 08, 2024
The BLOM Stock Index
BLOM BOND INDEX: Last Session’s Performance
| Last | Previous | Change | Y-t-D Change | ||
| BBI | 7.10 | 6.59 | 7.84% | 17.77% | |
| Weighted Yield | 202.86% | 211.65% | -879 | bps | |
| Duration (Years) | 1.59 | 1.53 | |||
| 5Y Bond Yield | 88.10% | 93.80% | -570 | bps | |
| 5Y Spread* | 8,386 | 8,960 | -574 | bps | |
| 10Y Bond Yield | 83.60% | 89.20% | -560 | bps | |
| 10Y Spread* | 7,971 | 8,536 | -565 | bps |
*spread between Lebanese Eurobonds and US Treasuries
| Price | Yield | Yield Change | |
| 12/06/2025 | 8.68 | 996.66% | (3,003) |
| 28/11/2026 | 8.55 | 192.77% | (748) |
| 23/03/2027 | 8.50 | 171.26% | (652) |
| 29/11/2027 | 8.51 | 135.09% | (533) |
| 03/11/2028 | 8.55 | 110.36% | (513) |
| 26/02/2030 | 8.54 | 93.15% | (618) |
| 22/04/2031 | 8.48 | 89.70% | (477) |
| 23/03/2032 | 8.55 | 85.87% | (651) |
| 02/11/2035 | 8.48 | 82.81% | (544) |
| 23/03/2037 | 8.56 | 84.41% | (654) |
Closing Date: October 07, 2024
Lebanese Forex Market
| Last Price | Previous | % Change | |
| $/LBP | 89,500 | 89,500 | – |
| €/LBP | 98,360.50 | 98,217.30 | 0.15% |
| £/LBP | 117,173.40 | 117,092.85 | 0.07% |
| NEER | 230.64 | 230.48 | 0.07% |
Closing Date: October 08, 2024