
Discover today’s performance of BLOM indices, the closing prices of Lebanese stocks and Eurobonds, as well as the exchange rate of major currencies against the LBP.
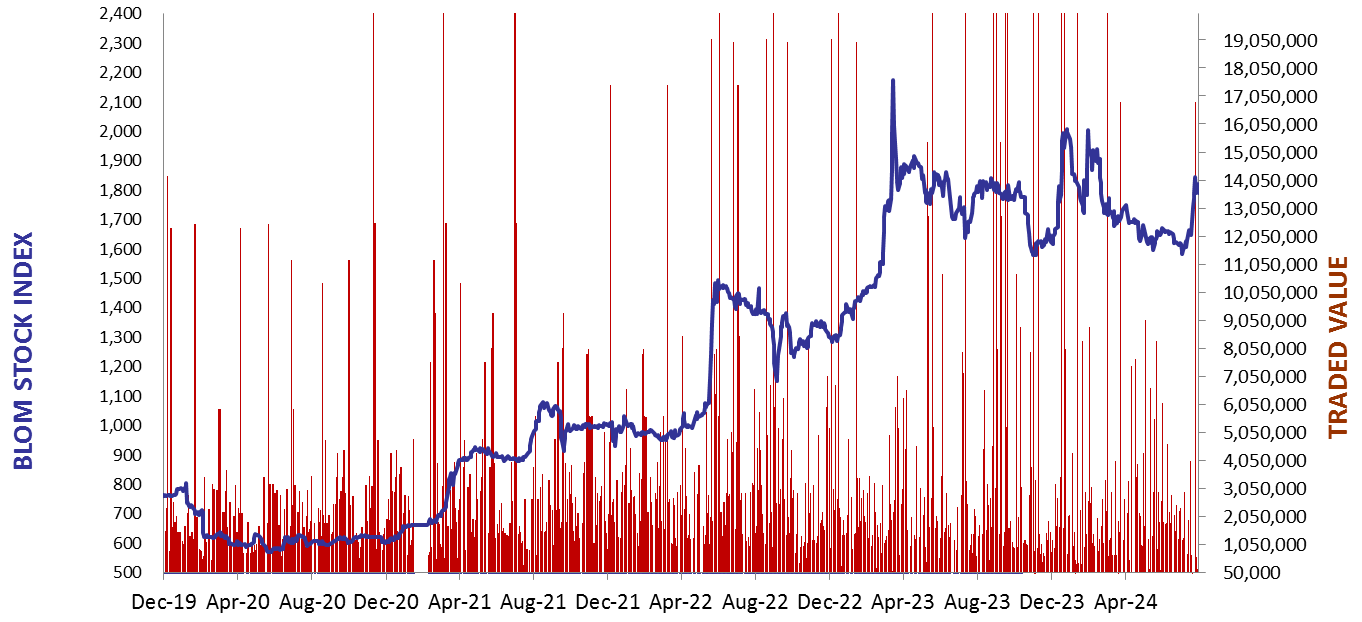
BLOM Stock Index (BSI) – today’s performance
| Last | Previous | % Change | Y-t-D Change | |
| BSI | 2,203.43 | 2,158.13 | 2.10% | 11.68% |
| High | 2,209.50 | 2,158.13 | ||
| Low | 2,196.22 | 2,147.72 | ||
| Volume | 7,026 | 2,690 | ||
| Val ($) | 696,062 | 262,326 |
I): BLOM preferred Shares Index (BPSI): today’s Performance
| Last | Previous | Change | |
| BPSI | 27.78 | 27.78 | 0.00% |
| Volume | |||
| Value |
Lebanese Stocks: today’s Trades and Closing Prices
| Last Price ($) | % Change | Volume | VWAP ($) | |
| Solidere A | 99.45 | 1.12% | 5,019 | 99.35 |
| Solidere B | 99.25 | 5.81% | 2,007 | 98.38 |
Closing Date: October 28, 2024
The BLOM Stock Index
BLOM BOND INDEX: Last Session’s Performance
| Last | Previous | Change | Y-t-D Change | ||
| BBI | 7.01 | 7.08 | -0.95% | 16.28% | |
| Weighted Yield | 221.69% | 218.84% | 284 | bps | |
| Duration (Years) | 1.54 | 1.55 | |||
| 5Y Bond Yield | 89.40% | 88.90% | 50 | bps | |
| 5Y Spread* | 8,511 | 8,465 | 46 | bps | |
| 10Y Bond Yield | 84.30% | 83.70% | 60 | bps | |
| 10Y Spread* | 8,025 | 7,968 | 57 | bps |
*spread between Lebanese Eurobonds and US Treasuries
| Price | Yield | Yield Change | |
| 12/06/2025 | 8.59 | 1181.85% | 2,267 |
| 28/11/2026 | 8.40 | 200.56% | 204 |
| 23/03/2027 | 8.43 | 174.75% | 89 |
| 29/11/2027 | 8.43 | 138.15% | 93 |
| 03/11/2028 | 8.43 | 112.88% | 92 |
| 26/02/2030 | 8.40 | 94.46% | 49 |
| 22/04/2031 | 8.40 | 90.95% | 101 |
| 23/03/2032 | 8.43 | 86.68% | 40 |
| 02/11/2035 | 8.45 | 83.64% | 60 |
| 23/03/2037 | 8.46 | 84.96% | 67 |
Closing Date: October 25, 2024
Lebanese Forex Market
| Last Price | Previous | % Change | |
| $/LBP | 89,500 | 89,500 | – |
| €/LBP | 96,821.10 | 96,597.35 | 0.23% |
| £/LBP | 116,215.75 | 115,983.05 | 0.20% |
| NEER | 230.74 | 230.95 | -0.09% |
Closing Date: October 28, 2024