
Discover today’s performance of BLOM indices, the closing prices of Lebanese stocks and Eurobonds, as well as the exchange rate of major currencies against the LBP.
BLOM Stock Index (BSI) – today’s performance
| Last | Previous | % Change | Y-t-D Change | |
| BSI | 2,148.18 | 2,152.08 | -0.18% | 8.88% |
| High | 2,162.08 | 2,173.55 | ||
| Low | 2,139.13 | 2,140.21 | ||
| Volume | 4,655 | 9,052 | ||
| Val ($) | 446,880 | 532,031 |
I): BLOM preferred Shares Index (BPSI): today’s Performance
| Last | Previous | Change | |
| BPSI | 27.78 | 27.78 | 0.00% |
| Volume | |||
| Value |
Lebanese Stocks: today’s Trades and Closing Prices
| Last Price ($) | % Change | Volume | VWAP ($) | |
| Solidere A | 95.25 | -1.09% | 252,880 | 95.25 |
| Solidere B | 97.00 | 1.04% | 194,000 | 97.00 |
Closing Date: October 31, 2024
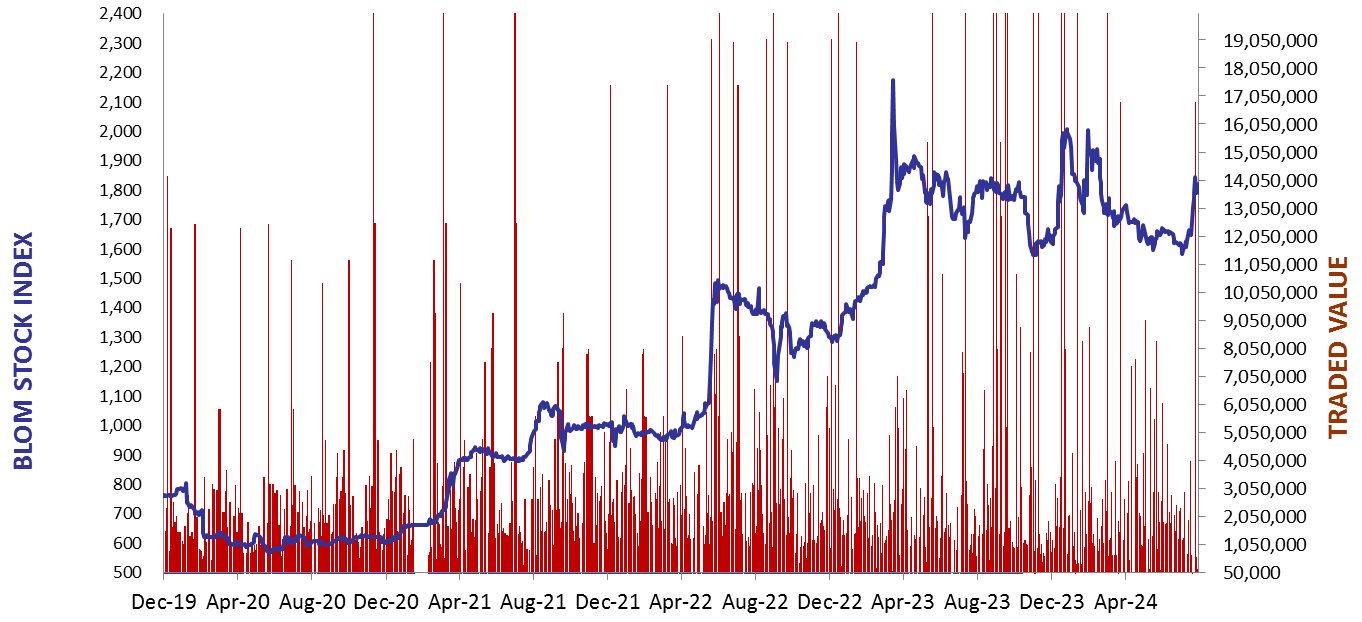
The BLOM Stock Index
BLOM BOND INDEX: Last Session’s Performance
| Last | Previous | Change | Y-t-D Change | ||
| BBI | 7.01 | 7.01 | -0.04% | 16.26% | |
| Weighted Yield | 227.67% | 226.26% | 141 | bps | |
| Duration (Years) | 1.52 | 1.52 | |||
| 5Y Bond Yield | 89.20% | 89.30% | -10 | bps | |
| 5Y Spread* | 8,492 | 8,501 | -9 | bps | |
| 10Y Bond Yield | 85.00% | 85.00% | 0 | bps | |
| 10Y Spread* | 8,086 | 8,092 | -6 | bps |
*spread between Lebanese Eurobonds and US Treasuries
| Price | Yield | Yield Change | |
| 12/06/2025 | 8.57 | 1244.97% | 1,461 |
| 28/11/2026 | 8.44 | 201.69% | 39 |
| 23/03/2027 | 8.39 | 175.97% | 60 |
| 29/11/2027 | 8.42 | 138.92% | 14 |
| 03/11/2028 | 8.42 | 113.40% | 12 |
| 26/02/2030 | 8.42 | 94.41% | (4) |
| 22/04/2031 | 8.47 | 90.22% | (5) |
| 23/03/2032 | 8.41 | 86.82% | (18) |
| 02/11/2035 | 8.40 | 84.30% | (1) |
| 23/03/2037 | 8.45 | 84.89% | 1 |
Closing Date: October 30, 2024
Lebanese Forex Market
| Last Price | Previous | % Change | |
| $/LBP | 89,500 | 89,500 | – |
| €/LBP | 97,107.50 | 97,152.25 | -0.05% |
| £/LBP | 116,072.55 | 116,009.90 | 0.05% |
| NEER | 230.96 | 230.95 | 0.00% |
Closing Date: October 31, 2024