
Discover today’s performance of BLOM indices, the closing prices of Lebanese stocks and Eurobonds, as well as the exchange rate of major currencies against the LBP.
BLOM Stock Index (BSI) – today’s performance
| Last | Previous | % Change | Y-t-D Change | |
| BSI | 2,568.66 | 2,595.98 | -1.05% | -2.24% |
| High | 2,572.58 | 2,653.19 | ||
| Low | 2,558.22 | 2,542.78 | ||
| Volume | 3,860 | 81,527 | ||
| Val ($) | 444,980 | 1,904,664 |
I): BLOM preferred Shares Index (BPSI): today’s Performance
| Last | Previous | Change | |
| BPSI | 27.52 | 27.52 | 0.00% |
| Volume | |||
| Value |
Lebanese Stocks: today’s Trades and Closing Prices
| Last Price ($) | % Change | Volume | VWAP ($) | |
| Solidere A | 115.20 | -2.37% | 3,760 | 115.21 |
| Solidere B | 118.00 | 0.00% | 100 | 118.00 |
Closing Date: January 7, 2025
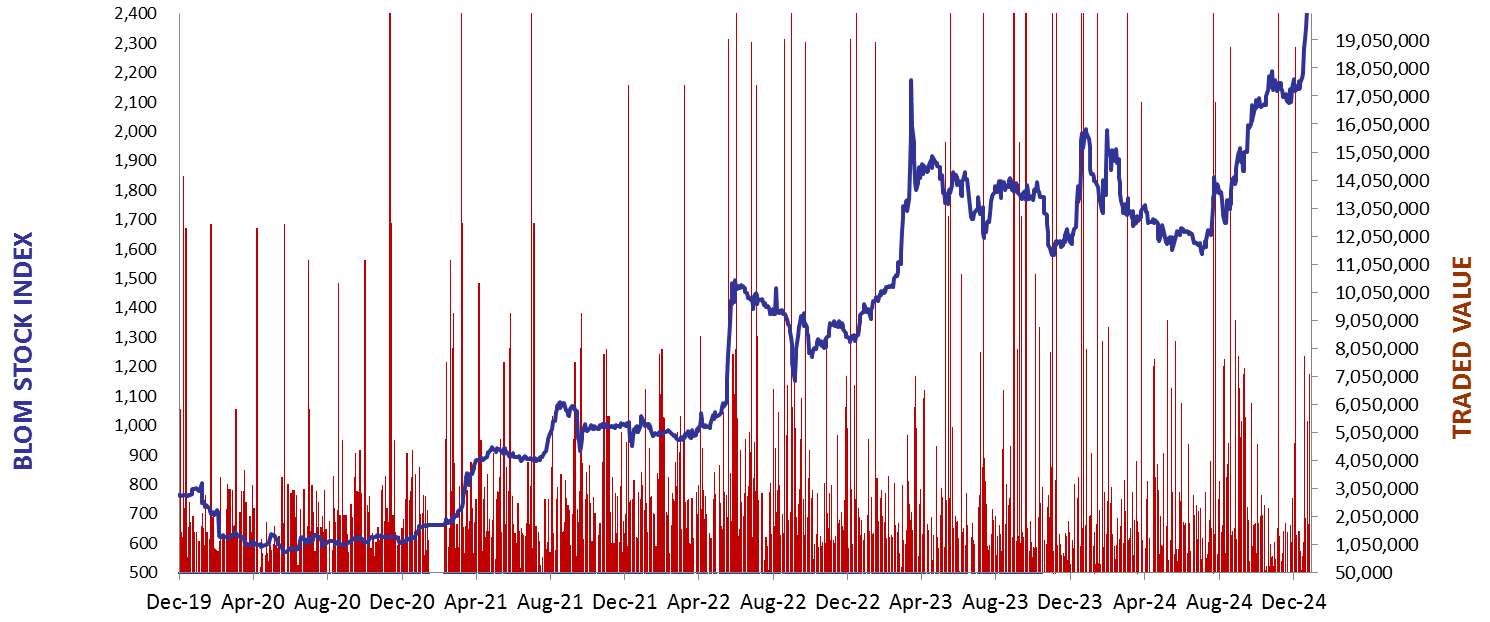
The BLOM Stock Index
BLOM BOND INDEX: Last Session’s Performance
| Last | Previous | Change | Y-t-D Change | ||
| BBI | 14.08 | 13.57 | 3.76% | 5.95% | |
| Weighted Yield | 100.21% | 102.58% | -236 | bps | |
| Duration (Years) | 2.12 | 2.09 | |||
| 5Y Bond Yield | 101.80% | 103.60% | -180 | bps | |
| 5Y Spread* | 9,739 | 9,922 | -183 | bps | |
| 10Y Bond Yield | 74.00% | 75.60% | -160 | bps | |
| 10Y Spread* | 6,940 | 7,103 | -163 | bps |
*spread between Lebanese Eurobonds and US Treasuries
| Price | Yield | Yield Change | |
| 28/11/2026 | 13.55 | 165.39% | (366) |
| 23/03/2027 | 13.47 | 141.38% | (270) |
| 29/11/2027 | 13.48 | 109.57% | (173) |
| 03/11/2028 | 13.58 | 86.05% | (162) |
| 26/02/2030 | 13.64 | 69.62% | (192) |
| 22/04/2031 | 13.40 | 64.59% | (62) |
| 23/03/2032 | 13.69 | 59.61% | (177) |
| 02/11/2035 | 13.64 | 53.46% | (148) |
| 23/03/2037 | 13.69 | 53.63% | (218) |
Closing Date: January 3, 2025
Lebanese Forex Market
| Last Price | Previous | % Change | |
| $/LBP | 89,500 | 89,500 | – |
| €/LBP | 93,276.90 | 92,990.50 | 0.31% |
| £/LBP | 112,304.60 | 112,027.15 | 0.25% |
| NEER | 234.66 | 235.15 | -0.21% |
Closing Date: January 7, 2025