
Discover today’s performance of BLOM indices, the closing prices of Lebanese stocks and Eurobonds, as well as the exchange rate of major currencies against the LBP.
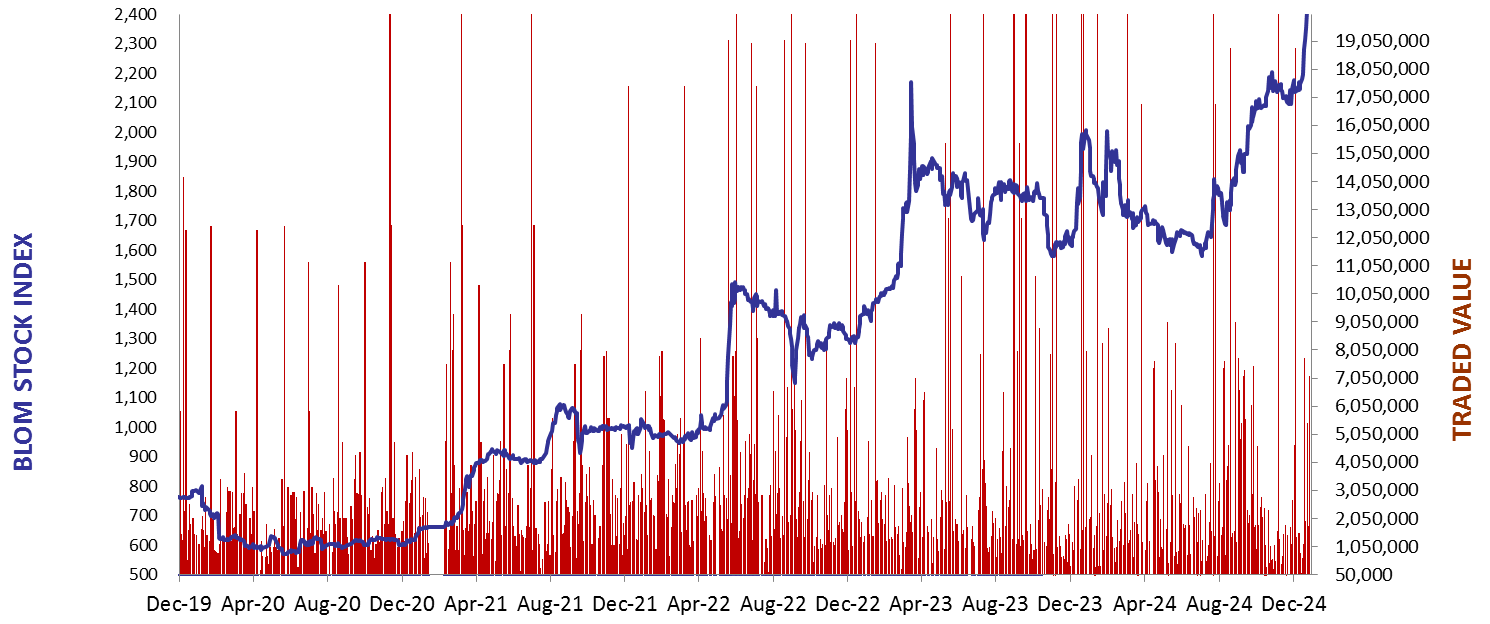
BLOM Stock Index (BSI) – today’s performance
| Last | Previous | % Change | Y-t-D Change | |
| BSI | 2,513.69 | 2,512.22 | 0.06% | -4.33% |
| High | 2,634.86 | |||
| Low | 2,490.27 | |||
| Volume | 8,292 | 27,071 | ||
| Val ($) | 459,593 | 251,625 |
I): BLOM preferred Shares Index (BPSI): today’s Performance
| Last | Previous | Change | |
| BPSI | 27.52 | 27.52 | 0.00% |
| Volume | |||
| Value |
Lebanese Stocks: today’s Trades and Closing Prices
| Last Price ($) | % Change | Volume | VWAP ($) | |
| Solidere A | 112.50 | 0.36% | 740 | 112.52 |
| Solidere B | 110.00 | -0.45% | 3,052 | 110.04 |
| BLOM GDR | 5.25 | -0.38% | 4,000 | 5.30 |
| CB (N) | 39.00 | 2.63% | 500 | 39.00 |
Closing Date: February 7, 2025
The BLOM Stock Index
BLOM BOND INDEX: Last Session’s Performance
| Last | Previous | Change | Y-t-D Change | ||
| BBI | 17.97 | 17.74 | 1.26% | 35.18% | |
| Weighted Yield | 87.07% | 87.79% | -73 | bps | |
| Duration (Years) | 2.29 | 2.28 | |||
| 5Y Bond Yield | 88.00% | 88.90% | -90 | bps | |
| 5Y Spread* | 8,372 | 8,466 | -94 | bps | |
| 10Y Bond Yield | 63.80% | 64.10% | -30 | bps | |
| 10Y Spread* | 5,935 | 5,967 | -32 | bps |
*spread between Lebanese Eurobonds and US Treasuries
| Price | Yield | Yield Change | |
| 28/11/2026 | 17.37 | 146.34% | (151) |
| 23/03/2027 | 17.33 | 124.61% | (73) |
| 29/11/2027 | 17.37 | 95.06% | (63) |
| 03/11/2028 | 17.37 | 74.35% | (51) |
| 26/02/2030 | 17.28 | 60.05% | (44) |
| 22/04/2031 | 17.34 | 53.99% | (43) |
| 23/03/2032 | 17.33 | 50.35% | (48) |
| 02/11/2035 | 17.36 | 43.47% | (40) |
| 23/03/2037 | 17.35 | 43.38% | (54) |
Closing Date: February 6, 2025
Lebanese Forex Market
| Last Price | Previous | % Change | |
| $/LBP | 89,500 | 89,500 | – |
| €/LBP | 93,035.25 | 92,927.85 | 0.12% |
| £/LBP | 111,525.95 | 111,293.25 | 0.21% |
| NEER | 234.88 | 234.72 | 0.07% |
Closing Date: February 7, 2025