
Discover today’s performance of BLOM indices, the closing prices of Lebanese stocks and Eurobonds, as well as the exchange rate of major currencies against the LBP.
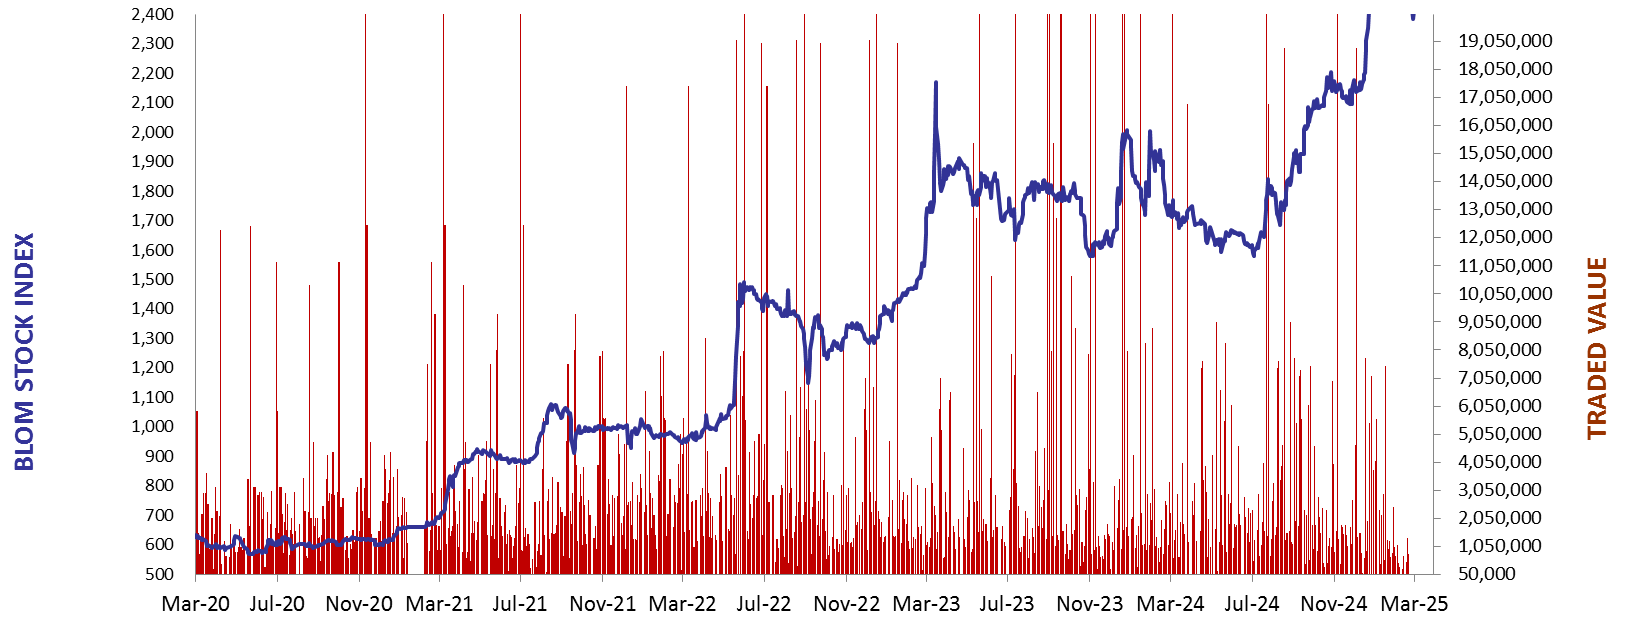
BLOM Stock Index (BSI) – today’s performance
| Last | Previous | % Change | Y-t-D Change | |
| BSI | 2,386.764 | 2,400.42 | -0.57% | -9.16% |
| Volume | 18,924 | 20,652 | ||
| Val ($) | 337,771 | 1,436,702 |
I): BLOM preferred Shares Index (BPSI): today’s Performance
| Last | Previous | Change | |
| BPSI | 27.52 | 27.52 | 0.00% |
| Volume | |||
| Value |
Lebanese Stocks: today’s Trades and Closing Prices
| Last Price ($) | % Change | Volume | VWAP ($) | |
| Solidere A | 102.60 | -1.35% | 3,050 | 102.61 |
| Bank Audi GDR | 2.35 | 0.00% | 5,000 | 2.40 |
| BEMO – Listed Shares | 1.20 | 0.00% | 10,874 | 1.20 |
Closing Date: March 13, 2025
The BLOM Stock Index
BLOM BOND INDEX: Last Session’s Performance
| Last | Previous | Change | Y-t-D Change | ||
| BBI | 18.99 | 19.15 | -0.81% | 42.89% | |
| Weighted Yield | 87.06% | 86.36% | 71 | bps | |
| Duration (Years) | 2.32 | 2.33 | |||
| 5Y Bond Yield | 87.30% | 87.05% | 25 | bps | |
| 5Y Spread* | 8,321 | 8,302 | 19 | bps | |
| 10Y Bond Yield | 62.15% | 62.00% | 15 | bps | |
| 10Y Spread* | 5,783 | 5,772 | 11 | bps |
*spread between Lebanese Eurobonds and US Treasuries
| Price | Yield | Yield Change | |
| 28/11/2026 | 18.27 | 149.90% | 180 |
| 23/03/2027 | 18.28 | 126.53% | 107 |
| 29/11/2027 | 18.35 | 94.51% | 58 |
| 03/11/2028 | 18.35 | 73.21% | 26 |
| 26/02/2030 | 18.30 | 58.51% | 27 |
| 22/04/2031 | 18.27 | 52.52% | 52 |
| 23/03/2032 | 18.43 | 48.55% | 19 |
| 02/11/2035 | 18.40 | 41.54% | 14 |
| 23/03/2037 | 18.38 | 41.40% | 26 |
Closing Date: March 12, 2025
Lebanese Forex Market
| Last Price | Previous | % Change | |
| $/LBP | 89,500 | 89,500 | – |
| €/LBP | 97,393.90 | 97,447.60 | -0.06% |
| £/LBP | 115,920.40 | 116,018.85 | -0.08% |
| NEER | 234.81 | 234.87 | -0.03% |
Closing Date: March 13, 2025