Discover today’s performance of BLOM indices, the closing prices of Lebanese stocks and Eurobonds, as well as the exchange rate of major currencies against the LBP.
BLOM Stock Index (BSI): Today’s Performance
| |
Last |
Previous |
% Change |
Y-t-D Change |
| BSI |
1,149.71 |
1,151.25 |
-0.13% |
-1.69% |
| High |
1,151.59 |
1,151.37 |
|
|
| Low |
1,147.88 |
1,148.47 |
|
|
| Volume |
122,656 |
132,205 |
13.76% |
|
| Val ($) |
639,759 |
1,242,125 |
-30.74% |
|
BLOM Preferred Shares Index (BPSI): Today’s Performance
| |
Last |
Previous |
Change |
| BPSI |
104.25 |
104.29 |
-0.04% |
| Volume |
2,102 |
56,316 |
|
| Value |
21,062 |
786,607 |
|
Lebanese Stocks: Today’s Trades and Closing Prices
|
Last Price |
% Change |
Volume |
VWAP |
| Solidere A |
9.37 |
0.21% |
5,453 |
9.33 |
| Solidere B |
9.34 |
-0.21% |
3,580 |
9.18 |
| BLOM Listed |
10.01 |
0.10% |
34,477 |
10.01 |
| BLOM (GDR) |
10.15 |
– |
150 |
10.15 |
| Audi (C) |
6.10 |
-0.81% |
5,175 |
6.10 |
| Audi (GDR) |
6.15 |
– |
8,790 |
6.15 |
| BYBLOS |
1.63 |
– |
62,929 |
1.63 |
| BEMO (C) |
1.75 |
– |
– |
– |
| BoB (C) |
18.80 |
– |
– |
|
| BLC (C) |
1.69 |
– |
– |
– |
| HOLCIM Liban |
14.31 |
– |
– |
– |
| CB (B) |
3.00 |
– |
– |
– |
| CB (N) |
3.10 |
– |
– |
– |
| BLOM Pref 2011 |
10.02 |
-0.30% |
2,102 |
10.02 |
| Audi Pref F |
100.30 |
– |
– |
– |
| Audi Pref G |
100.00 |
– |
– |
– |
| Audi Pref H |
100.00 |
– |
– |
– |
| Byblos Pref 08 |
100.20 |
– |
– |
– |
| Byblos Pref 09 |
100.10 |
|
– |
|
| BOB Pref H |
25.50 |
– |
– |
– |
| BoB Pref I |
25.50 |
– |
– |
– |
| BOB Preferred J |
25.50 |
– |
– |
– |
| BoB Priority 2014 |
21.00 |
– |
– |
– |
| BEMO PREF 13 |
100.00 |
– |
– |
– |
| BLC Pref A |
100.50 |
– |
– |
– |
| BLC Pref B |
100.00 |
– |
– |
– |
| BLC Pref C |
101.00 |
– |
– |
– |
| RYMCO |
3.23 |
– |
– |
– |
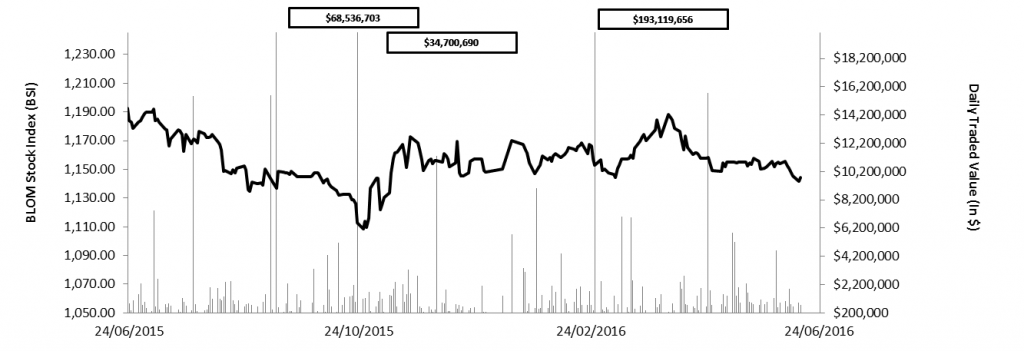
The BLOM Stock Index 52-WEEK TREND
Lebanese Global Depository Receipts: Last Session’s Performance
|
Last Price ($) |
Previous Price ($) |
% Change |
Volume |
Value ($) |
| BLOM GDR |
10.30 |
10.15 |
1.48% |
6,860 |
70,658 |
| Audi GDR |
6.00 |
6.00 |
– |
– |
– |
| Byblos GDR |
75.00 |
75.00 |
– |
– |
– |
| Solidere GDR |
9.19 |
9.24 |
-0.54% |
1,190 |
10,936 |
Source: Reuters Closing Date: 23 June 2016
BLOM BOND INDEX: Last Session’s Performance
| |
Last |
Previous |
Change |
Y-t-D Change |
| BBI |
102.573099 |
102.5731 |
0.00% |
-1.48% |
| Weighted Yield |
6.48% |
6.48% |
0 |
bps |
|
| Duration (Years) |
5.26 |
5.26 |
|
|
|
| 5Y Bond Yield |
6.38% |
6.38% |
0 |
bps |
|
| 5Y Spread* |
516 |
515 |
1 |
bps |
|
| 10Y Bond Yield |
7.00% |
6.99% |
1 |
bps |
|
| 10Y Spread* |
526 |
530 |
-4 |
bps |
|
*between Lebanese Eurobonds and US Treasuries
Closing Date: 23 June 2016
Lebanese Eurobonds: Last Sessions’ Prices and Yields
| |
Price |
Yield |
Yield Change (in bps) |
| Oct. 2017 |
99.5 |
5.40% |
0 |
| Jun. 2018 |
99.25 |
5.56% |
0 |
| Nov. 2018 |
98.88 |
5.66% |
0 |
| Apr. 2019 |
99 |
5.88% |
0 |
| May. 2019 |
100.25 |
5.90% |
0 |
| Nov.2019 |
98.38 |
5.98% |
0 |
| Mar. 2020 |
100.5 |
6.22% |
0 |
| Apr. 2020 |
98.5 |
6.25% |
0 |
| Apr. 2021 |
107.75 |
6.35% |
0 |
| Oct. 2022 |
97.75 |
6.54% |
0 |
| Jan. 2023 |
97 |
6.57% |
0 |
| Apr.2024 |
96.25 |
6.84% |
0 |
| Nov. 2024 |
99 |
6.81% |
0 |
| Dec. 2024 |
101 |
6.84% |
0 |
| Feb. 2025 |
95.75 |
6.86% |
0 |
| Jun. 2025 |
95.75 |
6.89% |
0 |
| Nov. 2026 |
96.75 |
7.04% |
0 |
| Nov. 2027 |
97.63 |
7.05% |
0 |
| Nov. 2028 |
96.65 |
7.06% |
0 |
| Feb. 2030 |
96.25 |
7.08% |
0 |
| Apr. 2031 |
99 |
7.11% |
0 |
| Nov. 2035 |
98 |
7.24% |
0 |
| |
Last Price |
Previous |
% Change |
Y-t-D |
| $/LBP |
1,514.00 |
1,514.00 |
– |
|
| €/LBP |
1,658.40 |
1,709.20 |
-2.97% |
|
| £/LBP |
2,033.17 |
2,223.41 |
-8.56% |
|
| NEER |
167.63 |
165.66 |
1.19% |
-0.45% |
Date: 24 June 2016