Discover today’s performance of BLOM indices, the closing prices of Lebanese stocks and Eurobonds, as well as the exchange rate of major currencies against the LBP.
BLOM Stock Index (BSI): Today’s Performance
| |
Last |
Previous |
%Change |
Y-t-D Change |
| BSI |
1,200.72 |
1,202.07 |
-0.11% |
-0.99% |
| High |
1,202.88 |
1,210.20 |
|
|
| Low |
722.77 |
1,201.50 |
|
|
| Volume |
169,418 |
149,743 |
13.14% |
|
| Val ($) |
1,798,059 |
1,041,251 |
72.68% |
|
BLOM Preferred Shares Index (BPSI): Today’s Performance
| |
Last |
Previous |
Change |
| BPSI |
105.40 |
105.40 |
0.00% |
| Volume |
2,400 |
4,850 |
|
| Value |
240,000 |
127,313 |
|
Lebanese Stocks: Today’s Trades and Closing Prices
|
Last Price ($) |
% Change |
Volume |
VWAP ($) |
| Solidere A |
9.75 |
-0.71% |
27,780 |
9.77 |
| Solidere B |
9.73 |
-0.21% |
3,738 |
9.72 |
| BLC Bank Pref D |
100 |
0.00% |
2,400 |
100 |
| BLOM GDR |
11.24 |
0.36% |
105,500 |
11.21 |
| Ciment Blanc (Bearer) |
2.25 |
-30.77% |
30,000 |
2.25 |
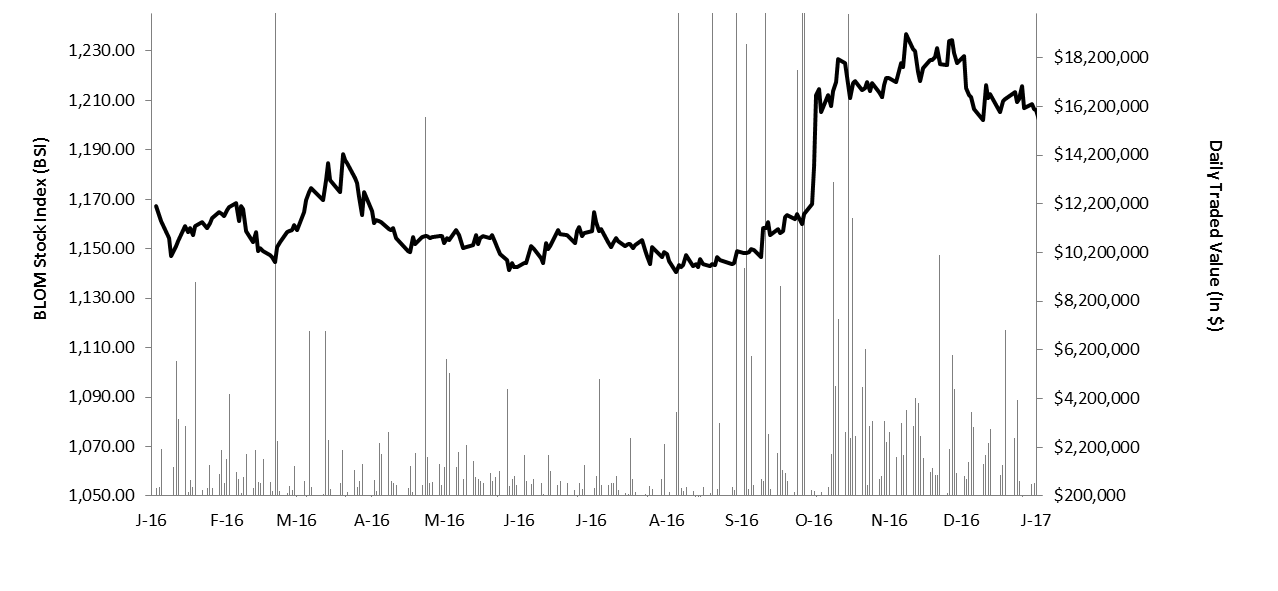
The BLOM Stock Index 52-WEEK TREND
Lebanese Global Depository Receipts: Last session’s Performance
| GDRs |
Last Price ($) |
Previous Price ($) |
% Change |
Volume |
Value ($) |
| BLOM GDR |
11.25 |
11.25 |
– |
41,219 |
463,714 |
| Audi GDR |
6.80 |
6.80 |
– |
– |
– |
| Byblos GDR |
76.00 |
76.00 |
– |
– |
– |
| Solidere GDR |
9.75 |
10.00 |
-2.50% |
51,638 |
503,471 |
Source: Reuters
Closing Date: 19 January 2017
BLOM BOND INDEX: Last Session’s Performance
| |
Last |
Previous |
Change |
Y-t-D Change |
| BBI |
104.00 |
104.00 |
0.00% |
|
2.06% |
| Weighted Yield |
6.18% |
6.18% |
0 |
bps |
|
| Duration (Years) |
5.02 |
5.03 |
|
|
|
| 5Y Bond Yield |
6.10% |
6.05% |
5 |
bps |
|
| 5Y Spread* |
413 |
412 |
1 |
bps |
|
| 10Y Bond Yield |
6.81% |
6.81% |
0 |
bps |
|
| 10Y Spread* |
434 |
439 |
-5 |
bps |
|
*between Lebanese Eurobonds and US Treasuries
Closing Date: 19 January 2017
Lebanese Eurobonds: Last Sessions’ Prices and Yields
| |
Price |
Yield |
Yield Change |
| 12/06/2018 |
100.25 |
4.96% |
0 |
| 12/11/2018 |
100.15 |
5.06% |
0 |
| 23/04/2019 |
100.05 |
5.47% |
0 |
| 20/05/2019 |
101.13 |
5.47% |
0 |
| 28/11/2019 |
99.88 |
5.49% |
0 |
| 09/03/2020 |
102.00 |
5.67% |
0 |
| 14/04/2020 |
100.25 |
5.71% |
0 |
| 19/06/2020 |
101.13 |
5.78% |
0 |
| 12/04/2021 |
108.63 |
5.91% |
0 |
| 04/10/2022 |
99.25 |
6.26% |
0 |
| 27/01/2023 |
98.50 |
6.30% |
0 |
| 22/04/2024 |
100.50 |
6.56% |
0 |
| 04/11/2024 |
98.00 |
6.58% |
0 |
| 03/12/2024 |
102.50 |
6.59% |
0 |
| 26/02/2025 |
97.38 |
6.62% |
0 |
| 12/06/2025 |
97.38 |
6.66% |
0 |
| 28/11/2026 |
98.50 |
6.81% |
0 |
| 29/11/2027 |
99.25 |
6.85% |
0 |
| 03/11/2028 |
97.75 |
6.93% |
0 |
| 26/02/2030 |
97.25 |
6.97% |
0 |
| 22/04/2031 |
99.50 |
7.05% |
1 |
| 02/11/2035 |
99.13 |
7.13% |
0 |
| |
Last Price |
Previous |
% Change |
Y-t-D |
| $/LBP |
1,514.00 |
1,514.00 |
– |
|
| €/LBP |
1,602.62 |
1,608.35 |
-0.36% |
|
| £/LBP |
1,849.10 |
1,857.69 |
-0.46% |
|
| NEER |
118.44 |
118.24 |
0.17% |
0.46% |
Closing Date: 20 January 2017