Discover today’s performance of BLOM indices, the closing prices of Lebanese stocks and Eurobonds, as well as the exchange rate of major currencies against the LBP.
BLOM Stock Index (BSI): Today’s Performance
| |
Last |
Previous |
%Change |
Y-t-D Change |
| BSI |
1,197.31 |
1,198.85 |
-0.13% |
-1.27% |
| High |
1,200.23 |
1,203.91 |
|
|
| Low |
1,196.70 |
1,196.90 |
|
|
| Volume |
23,175 |
186,468 |
-87.57% |
|
| Val ($) |
202,400 |
1,431,195 |
-85.86% |
|
BLOM Preferred Shares Index (BPSI): Today’s Performance
| |
Last |
Previous |
Change |
| BPSI |
105.50 |
105.40 |
0.09% |
| Volume |
338 |
44,741 |
|
| Value |
20,879 |
460,444 |
|
Lebanese Stocks: Today’s Trades and Closing Prices
|
Last Price ($) |
% Change |
Volume |
VWAP ($) |
| Solidere A |
9.54 |
0.42% |
15,663 |
9.54 |
| Solidere B |
9.61 |
– |
2,350 |
9.61 |
| Audi GDR |
6.85 |
1.03% |
20 |
6.85 |
| Bank of Beirut Preferred H |
26.25 |
– |
180 |
26.25 |
| Byblos Bank – Listed Shares |
1.70 |
-2.85% |
3,334 |
1.70 |
| Byblos Preferred 2008 |
102.00 |
-0.09% |
133 |
102.00 |
| Byblos Preferred 2009 |
103.50 |
0.87% |
25 |
103.50 |
| CB (B) |
2.42 |
10.00% |
1,470 |
2.42 |
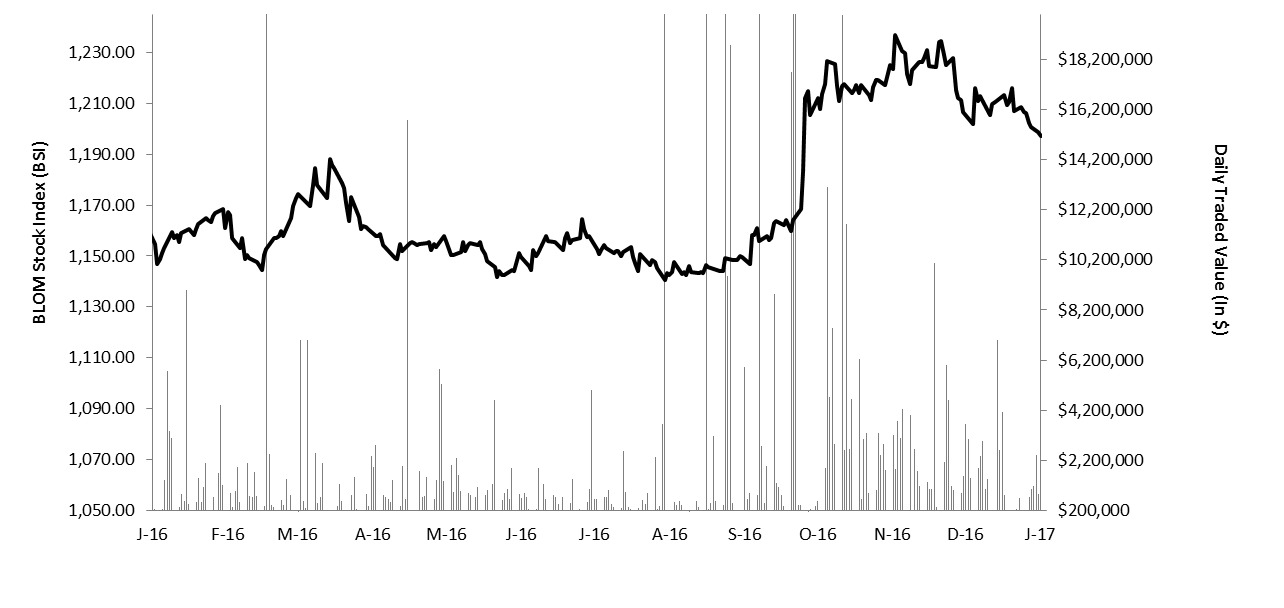
The BLOM Stock Index 52-WEEK TREND
Lebanese Global Depository Receipts: Last session’s Performance
| GDRs |
Last Price ($) |
Previous Price ($) |
% Change |
Volume |
Value ($) |
| BLOM GDR |
11.25 |
11.25 |
– |
– |
– |
| Audi GDR |
6.80 |
6.80 |
– |
– |
– |
| Byblos GDR |
76.00 |
76.00 |
– |
– |
– |
| Solidere GDR |
9.75 |
9.75 |
– |
– |
– |
Source: Reuters
Closing Date: 23 January 2017
BLOM BOND INDEX: Last Session’s Performance
| |
Last |
Previous |
Change |
Y-t-D Change |
| BBI |
103.87 |
103.48 |
0.38% |
|
1.93% |
| Weighted Yield |
6.20% |
6.28% |
-8 |
bps |
|
| Duration (Years) |
5.01 |
5.01 |
|
|
|
| 5Y Bond Yield |
6.13% |
6.25% |
-12 |
bps |
|
| 5Y Spread* |
425 |
430 |
-5 |
bps |
|
| 10Y Bond Yield |
6.84% |
6.88% |
-4 |
bps |
|
| 10Y Spread* |
443 |
440 |
3 |
bps |
|
*between Lebanese Eurobonds and US Treasuries
Closing Date: 23 January 2017
Lebanese Eurobonds: Last Sessions’ Prices and Yields
| |
Price |
Yield |
Yield Change |
| 12/06/2018 |
100.25 |
4.96% |
0 |
| 12/11/2018 |
100.15 |
5.06% |
0 |
| 23/04/2019 |
100.25 |
5.38% |
-12 |
| 20/05/2019 |
101.25 |
5.42% |
-12 |
| 28/11/2019 |
99.88 |
5.49% |
-5 |
| 09/03/2020 |
102.13 |
5.62% |
-22 |
| 14/04/2020 |
100.25 |
5.71% |
-17 |
| 19/06/2020 |
101.00 |
5.82% |
-12 |
| 12/04/2021 |
108.13 |
6.03% |
-7 |
| 04/10/2022 |
99.00 |
6.31% |
-11 |
| 27/01/2023 |
98.38 |
6.33% |
-13 |
| 22/04/2024 |
100.25 |
6.60% |
-13 |
| 04/11/2024 |
97.88 |
6.60% |
-15 |
| 03/12/2024 |
102.35 |
6.61% |
-14 |
| 26/02/2025 |
97.25 |
6.64% |
-12 |
| 12/06/2025 |
97.25 |
6.68% |
-12 |
| 28/11/2026 |
98.50 |
6.81% |
-7 |
| 29/11/2027 |
99.13 |
6.86% |
-2 |
| 03/11/2028 |
97.63 |
6.95% |
-5 |
| 26/02/2030 |
97.00 |
7.00% |
0 |
| 22/04/2031 |
99.25 |
7.08% |
-3 |
| 02/11/2035 |
98.75 |
7.17% |
-2 |
| |
Last Price |
Previous |
% Change |
Y-t-D |
| $/LBP |
1,514.00 |
1,514.00 |
– |
|
| €/LBP |
1,619.66 |
1,602.62 |
1.06% |
|
| £/LBP |
1,873.07 |
1,849.10 |
1.30% |
|
| NEER |
117.69 |
117.80 |
-0.09% |
0.46% |
Closing Date: 24 January 2017