Discover today’s performance of BLOM indices, the closing prices of Lebanese stocks and Eurobonds, as well as the exchange rate of major currencies against the LBP.
BLOM Stock Index (BSI): Today’s Performance
| |
Last |
Previous |
% Change |
Y-t-D Change |
| BSI |
1,157.11 |
1,156.44 |
0.06% |
-1.06% |
| High |
1,158.57 |
1,159.13 |
|
|
| Low |
1,152.93 |
1,154.74 |
|
|
| Volume |
87,253 |
67,227 |
29.79% |
|
| Val ($) |
725,185 |
654,964 |
10.72% |
|
BLOM Preferred Shares Index (BPSI): Today’s Performance
| |
Last |
Previous |
Change |
| BPSI |
104.26 |
104.26 |
0.00% |
| Volume |
9,201 |
4,080 |
|
| Value |
383,980 |
87,690 |
|
Lebanese Stocks: Today’s Trades and Closing Prices
| Active Stocks |
Volume
|
Value |
Closing Price |
% change
|
| Solidere A |
5,269
|
50,629 |
9.71 |
0.21%
|
| HOLCIM |
2,260
|
32,770 |
14.50 |
0.00%
|
| BLOM Bank – GDR |
3,000
|
30,210 |
10.07 |
0.20%
|
| Bank Audi |
13,797
|
85,541 |
6.20 |
0.00%
|
| Bank Audi – GDR |
11,891
|
72,742 |
6.12 |
-1.29%
|
| Byblos Bank |
41,835
|
69,313 |
1.66 |
1.22%
|
| Bank of Beirut Pref. Class J |
7,200
|
183,600 |
25.50 |
0.00%
|
| Bank Audi Pref F |
600
|
60,180 |
100.30 |
0.00%
|
| Bank Audi Pref G |
401
|
40,100 |
100.00 |
0.00%
|
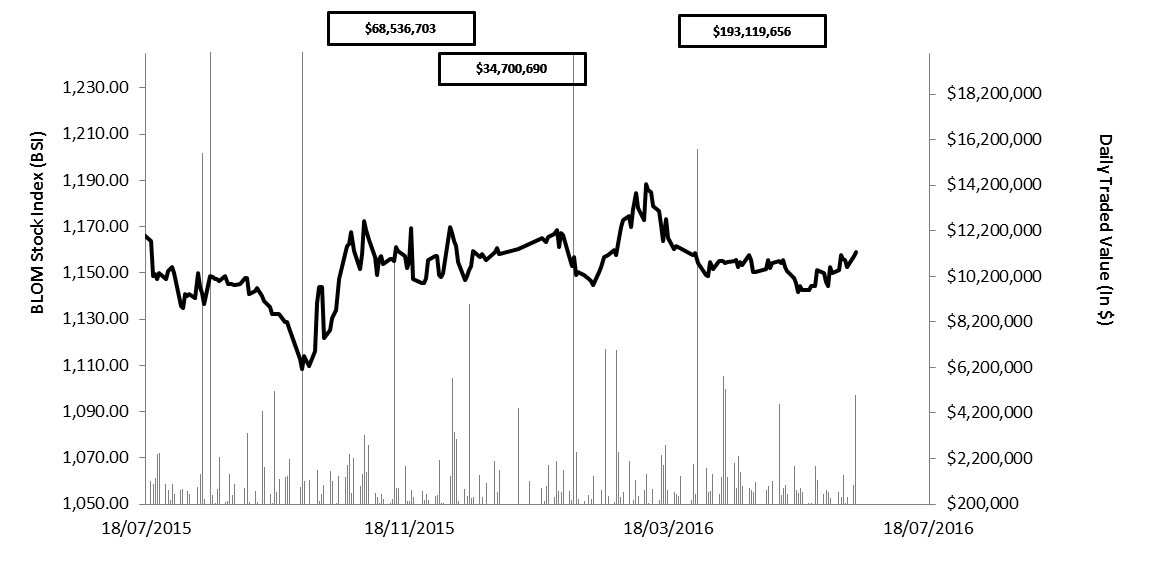
The BLOM Stock Index 52-WEEK TREND
Lebanese Global Depository Receipts: Last session’s Performance
|
GDRs
|
Last Price ($) |
Previous Price ($) |
% Change |
Volume |
Value ($) |
| BLOM GDR |
10.05
|
10.05 |
– |
– |
–
|
| Audi GDR |
6.20
|
6.20 |
– |
112 |
694
|
| Byblos GDR |
75.00
|
75.00 |
– |
– |
–
|
| Solidere GDR |
9.70 |
9.58 |
1.25% |
11,000 |
106,700
|
Source: Reuters Closing Date: 15 July 2016
BLOM BOND INDEX: Last Session’s Performance
| |
Last |
Previous |
Change |
Y-t-D Change |
| BBI |
103.39
|
103.39 |
0.00% |
-0.69%
|
| Weighted Yield |
6.31%
|
6.31% |
0 |
bps
|
|
| Duration (Years) |
5.21
|
5.21 |
|
|
|
| 5Y Bond Yield |
6.18%
|
6.18% |
0 |
bps
|
|
| 5Y Spread* |
531
|
508 |
23 |
bps
|
|
|
10Y Bond Yield
|
6.85% |
6.85% |
0 |
bps
|
|
| 10Y Spread* |
543
|
532 |
11 |
bps
|
|
*between Lebanese Eurobonds and US Treasuries
Closing Date: 15 July 2016
Lebanese Eurobonds: Last Sessions’ Prices and Yields
| |
Price |
Yield |
Yield Change |
| Oct. 2017 |
99.63 |
5.30% |
0 |
| Jun. 2018 |
99.63 |
5.35% |
0 |
| Nov. 2018 |
99.38 |
5.43% |
0 |
| Apr. 2019 |
99.5 |
5.69% |
0 |
| May. 2019 |
100.75 |
5.71% |
0 |
| Nov.2019 |
99 |
5.78% |
0 |
| Mar. 2020 |
101.38 |
5.95% |
0 |
| Apr. 2020 |
99.38 |
5.98% |
0 |
| Apr. 2021 |
108.5 |
6.15% |
0 |
| Oct. 2022 |
98.88 |
6.32% |
0 |
| Jan. 2023 |
98 |
6.38% |
0 |
| Apr.2024 |
97 |
6.73% |
0 |
| Nov. 2024 |
99.88 |
6.67% |
0 |
| Dec. 2024 |
101.5 |
6.76% |
0 |
| Feb. 2025 |
96.25 |
6.78% |
0 |
| Jun. 2025 |
96.25 |
6.82% |
0 |
| Nov. 2026 |
98 |
6.87% |
0 |
| Nov. 2027 |
98.75 |
6.91% |
0 |
| Nov. 2028 |
97.75 |
6.92% |
0 |
| Feb. 2030 |
97 |
6.99% |
0 |
| Apr. 2031 |
99.5 |
7.05% |
0 |
| Nov. 2035 |
99 |
7.14% |
0 |
| |
Last Price
|
Previous |
% Change |
Y-t-D |
| $/LBP |
1,514.00
|
1,514.00 |
–
|
|
| €/LBP |
1,665.34
|
1,662.32 |
0.18%
|
|
| £/LBP |
1,996.53
|
1,947.99 |
2.49%
|
|
|
NEER
|
167.01 |
166.39 |
0.37% |
-0.82%
|
Closing Date: 18 July