
Daily Capital Markets’ Performance
Discover today’s performance of BLOM indices, the closing prices of Lebanese stocks and Eurobonds.
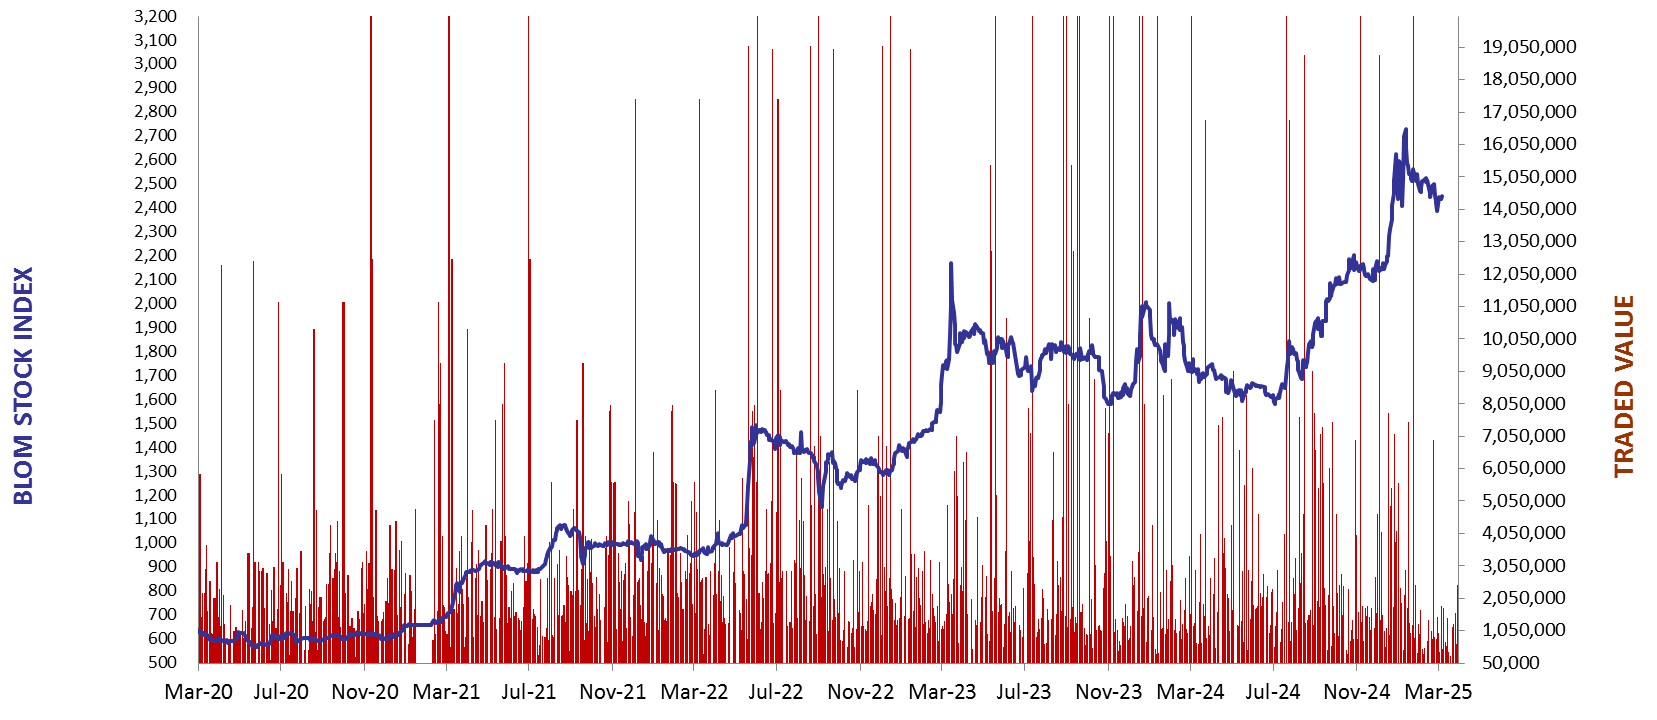
BLOM Stock Index (BSI) – today’s performanc
| Last | Previous | % Change | Y-t-D Change | |
| BSI | 1,916.61 | 1,922.39 | -0.30% | -27.06% |
| Volume | 33,738 | 6,400 | ||
| Val ($) | 2,522,041 | 497,600 |
I): BLOM preferred Shares Index (BPSI): today’s Performance
| Last | Previous | Change | |
| BPSI | 19.35 | 19.35 | 0.00% |
Lebanese Stocks: today’s Trades and Closing Prices
| Last Price ($) | % Change | Volume | |
| Solidere A | 77.45 | 0.19% | 24,238 |
| Solidere B | 85.00 | 2.40% | 7,500 |
| BLOM Bank – Listed shares | 6.25 | -13.19% | 2,000 |
Closing Date: December 29, 2025
The BLOM Stock Index
BLOM BOND INDEX: Last Session’s Performance
| Last | Previous | Change | Y-t-D Change | ||
| BBI | 24.29 | 24.25 | 0.14% | 82.76% | |
| Weighted Yield | 67.15% | 67.11% | 4 | bps | |
| Duration (Years) | 2.74 | 2.75 | |||
| 5Y Bond Yield | 49.80% | 49.85% | -5 | bps | |
| 5Y Spread* | 4,612 | 4,615 | -3 | bps | |
| 10Y Bond Yield | 35.00% | 35.00% | 0 | bps | |
| 10Y Spread* | 3,086 | 3,085 | 1 | bps |
*spread between Lebanese Eurobonds and US Treasuries
| Price | Yield | Yield Change | |
| 23/03/2027 | 23.42 | 177.61% | 47 |
| 29/11/2027 | 23.50 | 109.67% | (1) |
| 20/03/2028 | 23.43 | 95.30% | (1) |
| 03/11/2028 | 23.30 | 75.67% | 23 |
| 25/05/2029 | 23.40 | 65.35% | 2 |
| 27/11/2029 | 23.42 | 71.95% | (6) |
| 26/02/2030 | 23.41 | 55.35% | (1) |
| 22/04/2031 | 23.30 | 47.77% | 16 |
| 20/11/2031 | 23.40 | 45.15% | 4 |
| 23/03/2032 | 23.39 | 43.23% | (0) |
| 17/05/2033 | 23.43 | 43.18% | (6) |
| 17/05/2034 | 23.43 | 41.17% | (7) |
| 27/07/2035 | 23.43 | 52.93% | 5 |
| 02/11/2035 | 23.37 | 35.06% | (2) |
| 23/03/2037 | 23.36 | 34.24% | 1 |
Closing Date: December 26, 2025


