Daily Capital Markets’ Performance
Discover today’s performance of BLOM indices, the closing prices of Lebanese stocks and Eurobonds.
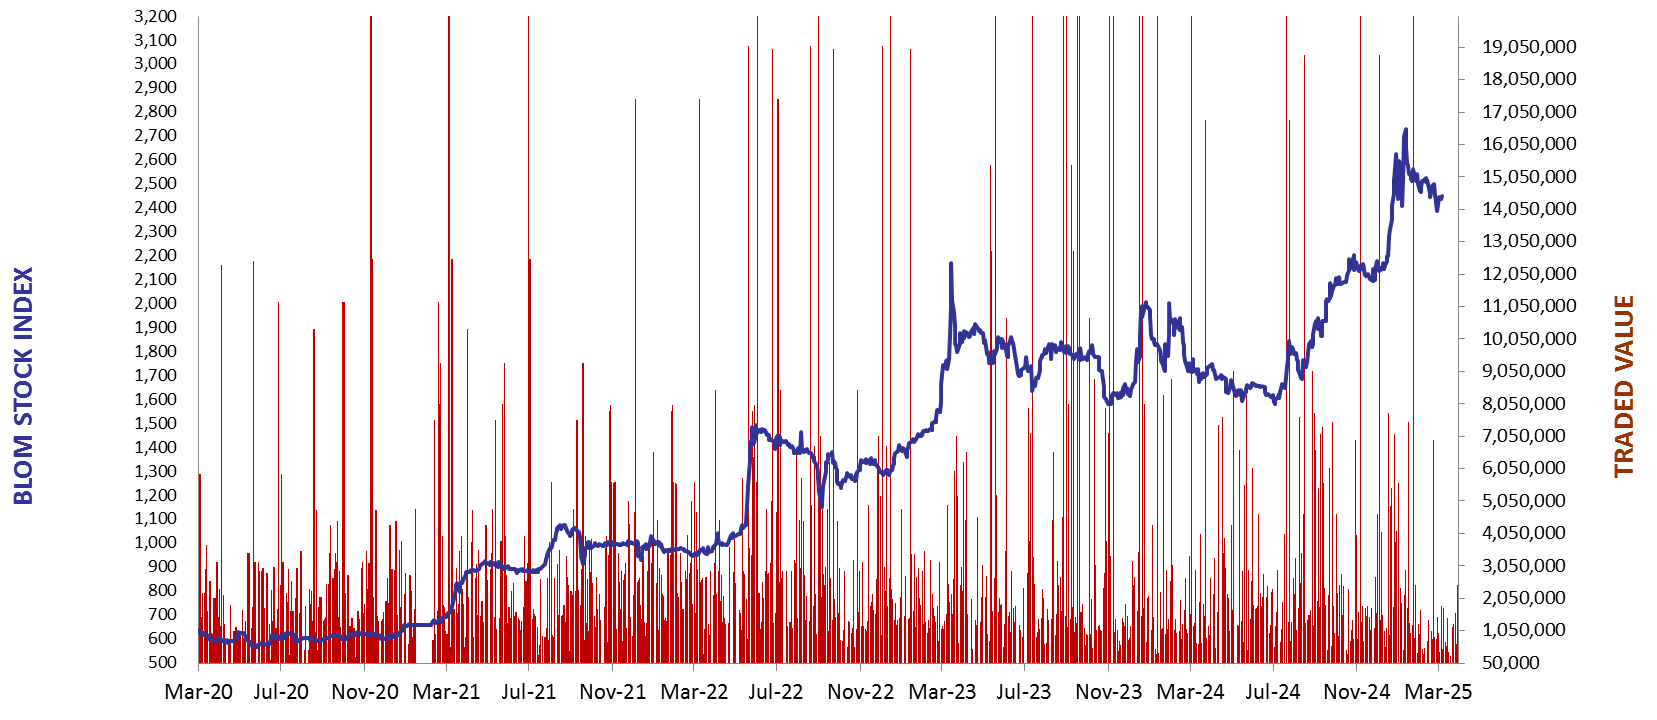
BLOM Stock Index (BSI) – today’s performance
| Last | Previous | % Change | Y-t-D Change | |
| BSI | 1,965.93 | 1,916.61 | 2.57% | -25.18% |
| Volume | 186,900 | 33,738 | ||
| Val ($) | 3,104,820 | 2,522,041 |
I): BLOM preferred Shares Index (BPSI): today’s Performance
| Last | Previous | Change | |
| BPSI | 19.35 | 19.35 | 0.00% |
Lebanese Stocks: today’s Trades and Closing Prices
| Last Price ($) | % Change | Volume | |
| Solidere A | 84.00 | 8.45% | 32,500 |
| Solidere B | 82.70 | -2.70% | 4,400 |
| Byblos Bank | 0.59 | 0.00% | 150,000 |
Closing Date: December 30, 2025
The BLOM Stock Index
BLOM BOND INDEX: Last Session’s Performance
| Last | Previous | Change | Y-t-D Change | ||
| BBI | 24.21 | 24.29 | -0.32% | 82.17% | |
| Weighted Yield | 67.58% | 67.15% | 43 | bps | |
| Duration (Years) | 2.73 | 2.74 | |||
| 5Y Bond Yield | 49.90% | 49.80% | 10 | bps | |
| 5Y Spread* | 4,623 | 4,612 | 11 | bps | |
| 10Y Bond Yield | 35.10% | 35.00% | 10 | bps | |
| 10Y Spread* | 3,098 | 3,086 | 12 | bps |
*spread between Lebanese Eurobonds and US Treasuries
| Price | Yield | Yield Change | |
| 23/03/2027 | 23.28 | 179.99% | 237 |
| 29/11/2027 | 23.34 | 110.75% | 108 |
| 20/03/2028 | 23.23 | 96.29% | 99 |
| 03/11/2028 | 23.27 | 75.93% | 26 |
| 25/05/2029 | 23.27 | 65.74% | 39 |
| 27/11/2029 | 23.41 | 72.06% | 11 |
| 26/02/2030 | 23.30 | 55.63% | 28 |
| 22/04/2031 | 23.39 | 47.67% | (10) |
| 20/11/2031 | 23.33 | 45.28% | 13 |
| 23/03/2032 | 23.34 | 43.33% | 10 |
| 17/05/2033 | 23.36 | 43.29% | 11 |
| 17/05/2034 | 23.35 | 41.29% | 12 |
| 27/07/2035 | 23.39 | 53.03% | 10 |
| 02/11/2035 | 23.33 | 35.12% | 6 |
| 23/03/2037 | 23.36 | 34.25% | 1 |
Closing Date: December 29, 2025