Discover today’s performance of BLOM indices, the closing prices of Lebanese stocks and Eurobonds, as well as the exchange rate of major currencies against the LBP.
BLOM Stock Index (BSI): Today’s Performance
| |
Last |
Previous |
% Change |
Y-t-D Change |
| BSI |
1,169.21 |
1,161.45 |
0.67% |
-3.59% |
| High |
1,172.65 |
1,163.60 |
|
|
| Low |
1,161.45 |
1,159.49 |
|
|
| Volume |
504,073 |
309,475 |
62.88% |
|
| Val ($) |
2,194,386 |
2,407,718 |
-8.86% |
|
BLOM Preferred Shares Index (BPSI): Today’s Performance
| |
Last |
Previous |
Change |
| BPSI |
104.81 |
104.79 |
0.02% |
| Volume |
6,180 |
8,764 |
|
| Value |
450,097 |
459,005 |
|
Lebanese Stocks: Today’s Trades and Closing Prices
| |
Last Price ($) |
% Change |
Volume |
VWAP ($) |
| Solidere A |
9.04 |
1.46% |
52,060 |
8.99 |
| Solidere B |
8.91 |
-0.78% |
16,922 |
9.03 |
| Bank Audi |
6.21 |
3.67% |
20,150 |
6.16 |
| Bank of Beirut Priority 2014 |
21.00 |
0.00% |
13,888 |
21.00 |
| Bank of Beirut Pref H |
25.15 |
0.00% |
2,000 |
25.15 |
| Bank of Beirut Pref K |
25.15 |
0.00% |
4,140 |
25.15 |
| Byblos Bank – Listed Shares |
1.64 |
-0.61% |
358,287 |
1.64 |
| Byblos Bank – Pref 2009 |
100.70 |
0.10% |
40 |
100.70 |
| Blom – Listed Shares |
10.84 |
-0.09% |
21,583 |
10.84 |
| Blom GDR |
11.85 |
0.42% |
15,003 |
11.85 |
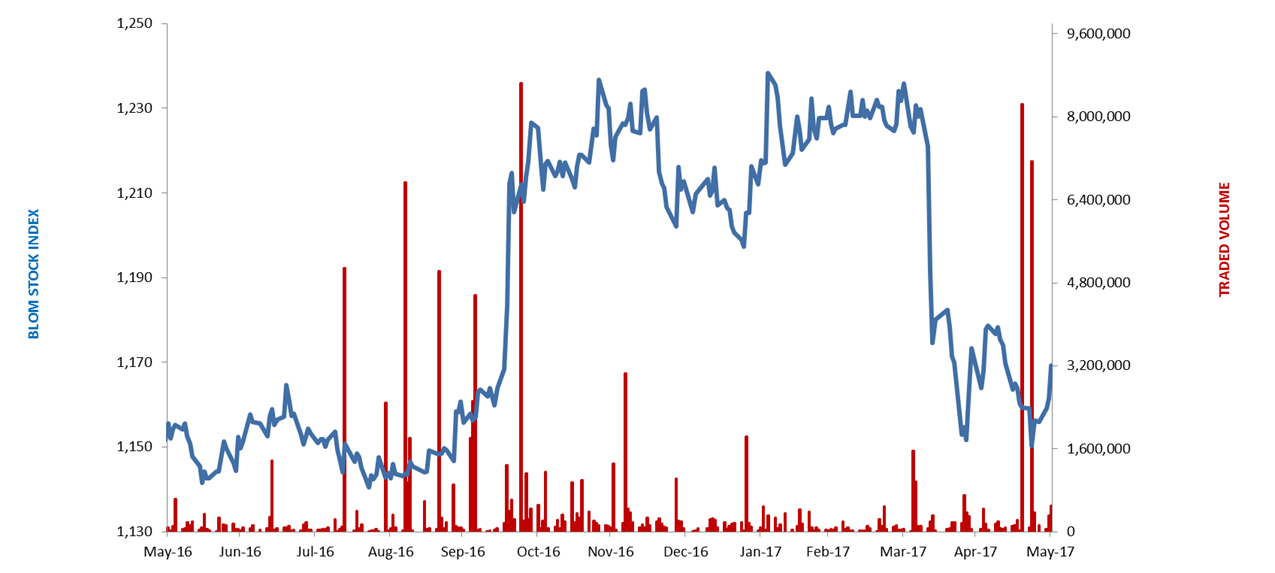
The BLOM Stock Index
Lebanese Global Depository Receipts: Last session’s Performance
| GDRs |
Last Price ($) |
Previous Price ($) |
% Change |
Volume |
Value ($) |
| BLOM GDR |
11.95 |
11.80 |
1.27% |
3,250 |
38,838 |
| Audi GDR |
6.40 |
6.10 |
4.92% |
104,954 |
671,706 |
| Byblos GDR |
82.00 |
82.00 |
– |
– |
– |
| Solidere GDR |
8.52 |
8.82 |
-3.40% |
3,806 |
32,427 |
Source: Reuters
Closing Date: 30 May 2017
BLOM BOND INDEX: Last Session’s Performance
| |
Last |
Previous |
Change |
Y-t-D Change |
| BBI |
105.66 |
105.70 |
-0.04% |
|
3.69% |
| Weighted Yield |
5.967% |
5.955% |
1.15 |
bps |
|
| Duration (Years) |
5.34 |
5.34 |
|
|
|
| 5Y Bond Yield |
5.72% |
5.71% |
1 |
bps |
|
| 5Y Spread* |
396 |
392 |
4 |
bps |
|
| 10Y Bond Yield |
6.63% |
6.63% |
0 |
bps |
|
| 10Y Spread* |
442 |
438 |
4 |
bps |
|
*between Lebanese Eurobonds and US Treasuries
Closing Date: 30 May 2017
Lebanese Eurobonds: Last Sessions’ Prices and Yields
| |
Price |
Yield |
Yield Change |
| 12/06/2018 |
100.63 |
4.52% |
0 |
| 12/11/2018 |
100.75 |
4.61% |
0 |
| 23/04/2019 |
101.00 |
4.94% |
3 |
| 20/05/2019 |
101.88 |
4.99% |
6 |
| 28/11/2019 |
101.00 |
5.02% |
0 |
| 09/03/2020 |
102.50 |
5.39% |
6 |
| 14/04/2020 |
100.88 |
5.46% |
5 |
| 19/06/2020 |
101.75 |
5.52% |
7 |
| 12/04/2021 |
109.25 |
5.56% |
0 |
| 04/10/2022 |
101.50 |
5.77% |
0 |
| 27/01/2023 |
100.75 |
5.84% |
3 |
| 22/04/2024 |
102.25 |
6.24% |
2 |
| 04/11/2024 |
99.75 |
6.29% |
2 |
| 03/12/2024 |
104.13 |
6.30% |
2 |
| 26/02/2025 |
99.38 |
6.30% |
0 |
| 12/06/2025 |
99.50 |
6.33% |
0 |
| 28/11/2026 |
100.50 |
6.53% |
0 |
| 23/03/2027 |
101.63 |
6.62% |
0 |
| 29/11/2027 |
100.63 |
6.67% |
0 |
| 03/11/2028 |
99.63 |
6.70% |
0 |
| 26/02/2030 |
99.25 |
6.74% |
0 |
| 22/04/2031 |
101.00 |
6.89% |
0 |
| 23/03/2032 |
100.63 |
6.93% |
1 |
| 02/11/2035 |
100.00 |
7.05% |
0 |
| 23/03/2037 |
101.38 |
7.12% |
0 |
| |
Last Price |
Previous |
% Change |
Y-t-D |
| $/LBP |
1,514.00 |
1,514.25 |
-0.02% |
|
| €/LBP |
1,831.61 |
1,686.59 |
8.60% |
|
| £/LBP |
1,936.38 |
1,938.49 |
-0.11% |
|
| NEER |
114.19 |
114.49 |
-0.26% |
-3.56% |
Closing Date: 31 May 2017