Discover today’s performance of BLOM indices, the closing prices of Lebanese stocks and Eurobonds, as well as the exchange rate of major currencies against the LBP.
BLOM Stock Index (BSI): Today’s Performance
| |
Last |
Previous |
% Change |
Y-t-D Change |
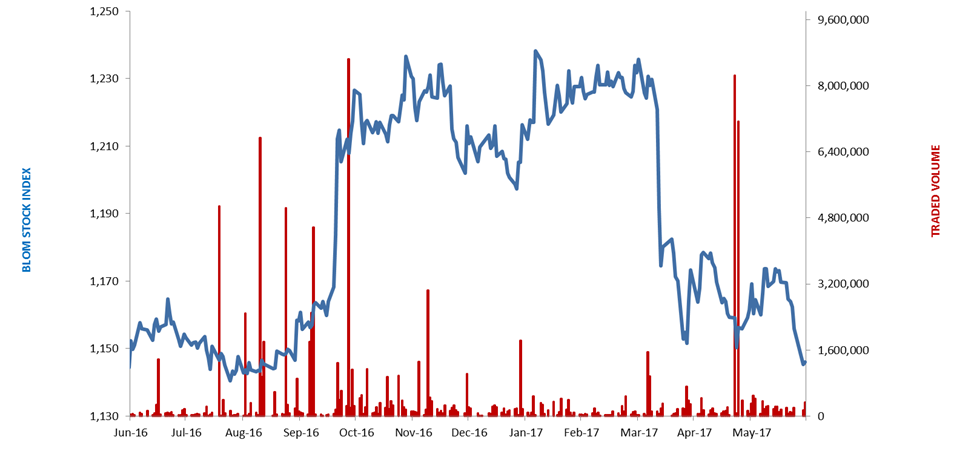
| BSI |
1,146.04 |
1,145.35 |
0.06% |
-5.50% |
| High |
1,148.74 |
1,155.92 |
|
|
| Low |
1,144.60 |
1,139.94 |
|
|
| Volume |
184,494 |
331,228 |
-44.30% |
|
| Val ($) |
1,405,291 |
3,409,000 |
-58.78% |
|
BLOM Preferred Shares Index (BPSI): Today’s Performance
| |
Last |
Previous |
Change |
| BPSI |
104.69 |
104.68 |
0.01% |
| Volume |
2,360 |
– |
|
| Value |
88,215 |
– |
|
Lebanese Stocks: Today’s Trades and Closing Prices
| |
Last Price ($) |
% Change |
Volume |
VWAP ($) |
| Solidere A |
7.92 |
-0.75% |
106,268 |
7.93 |
| Solidere B |
7.83 |
0.64% |
1,896 |
7.84 |
| Bank Audi GDR |
6.00 |
0.00% |
2,000 |
6.00 |
| Bank of Beirut Listed |
18.80 |
0.00% |
5,000 |
18.80 |
| Bank of Beirut Pref H |
25.15 |
0.00% |
1,980 |
25.15 |
| Byblos Bank Listed |
1.65 |
1.23% |
42,395 |
1.65 |
| Byblos Bank Pref 2008 |
101.10 |
0.10% |
380 |
101.10 |
| Blom Listed |
11.15 |
0.00% |
13,345 |
11.15 |
| Blom GDR |
12.00 |
-0.33% |
11,230 |
12.00 |
The BLOM Stock Index
Lebanese Global Depository Receipts: Last session’s Performance
| GDRs |
Last Price ($) |
Previous Price ($) |
% Change |
Volume |
Value ($) |
| BLOM GDR |
12 |
12 |
0.0% |
– |
– |
| Audi GDR |
6.16 |
6.16 |
0.0% |
– |
– |
| Byblos GDR |
80 |
80 |
0.0% |
– |
– |
| Solidere GDR |
Trading terminated on London Stock Exchange effective June 29, 2017. |
7.67 |
– |
– |
– |
Source: Reuters
Closing Date: 28 June 2017
BLOM BOND INDEX: Last Session’s Performance
| |
Last |
Previous |
Change |
Y-t-D Change |
| BBI |
105.29 |
105.55 |
-0.24% |
|
3.33% |
| Weighted Yield |
6.030% |
5.979% |
5.08 |
bps |
|
| Duration (Years) |
5.27 |
5.27 |
|
|
|
| 5Y Bond Yield |
5.90% |
5.85% |
5 |
bps |
|
| 5Y Spread* |
409 |
402 |
7 |
bps |
|
| 10Y Bond Yield |
6.66% |
6.62% |
4 |
bps |
|
| 10Y Spread* |
444 |
441 |
3 |
bps |
|
*between Lebanese Eurobonds and US Treasuries
Closing Date: 28 June 2017
Lebanese Eurobonds: Last Sessions’ Prices and Yields
| |
Price |
Yield |
Yield Change |
| 12/06/2018 |
100.70 |
4.39% |
0 |
| 12/11/2018 |
100.88 |
4.48% |
0 |
| 23/04/2019 |
100.88 |
4.98% |
7 |
| 20/05/2019 |
101.75 |
5.02% |
7 |
| 28/11/2019 |
100.85 |
5.07% |
7 |
| 09/03/2020 |
102.25 |
5.46% |
5 |
| 14/04/2020 |
100.75 |
5.50% |
5 |
| 19/06/2020 |
101.63 |
5.55% |
4 |
| 12/04/2021 |
108.13 |
5.82% |
10 |
| 04/10/2022 |
100.75 |
5.93% |
8 |
| 27/01/2023 |
100.00 |
6.00% |
5 |
| 22/04/2024 |
101.75 |
6.33% |
5 |
| 04/11/2024 |
99.50 |
6.33% |
2 |
| 03/12/2024 |
103.88 |
6.34% |
2 |
| 26/02/2025 |
99.00 |
6.37% |
2 |
| 12/06/2025 |
99.00 |
6.41% |
4 |
| 28/11/2026 |
100.50 |
6.53% |
4 |
| 23/03/2027 |
101.38 |
6.65% |
5 |
| 29/11/2027 |
100.50 |
6.68% |
3 |
| 03/11/2028 |
99.00 |
6.78% |
5 |
| 26/02/2030 |
98.75 |
6.80% |
5 |
| 22/04/2031 |
100.88 |
6.90% |
1 |
| 23/03/2032 |
100.50 |
6.94% |
5 |
| 02/11/2035 |
100.00 |
7.05% |
2 |
| 23/03/2037 |
101.00 |
7.15% |
2 |
| |
Last Price |
Previous |
% Change |
Y-t-D |
| $/LBP |
1,514.00 |
1,514.00 |
– |
|
| €/LBP |
1,720.66 |
1,714.93 |
0.33% |
|
| £/LBP |
1,955.08 |
1,948.29 |
0.35% |
|
| NEER |
113.52 |
113.88 |
-0.32% |
-4.12% |
Closing Date: 29 June 2017