Discover today’s performance of BLOM indices, the closing prices of Lebanese stocks and Eurobonds, as well as the exchange rate of major currencies against the LBP.
BLOM Stock Index (BSI): Today’s Performance
| |
Last |
Previous |
% Change |
Y-t-D Change |
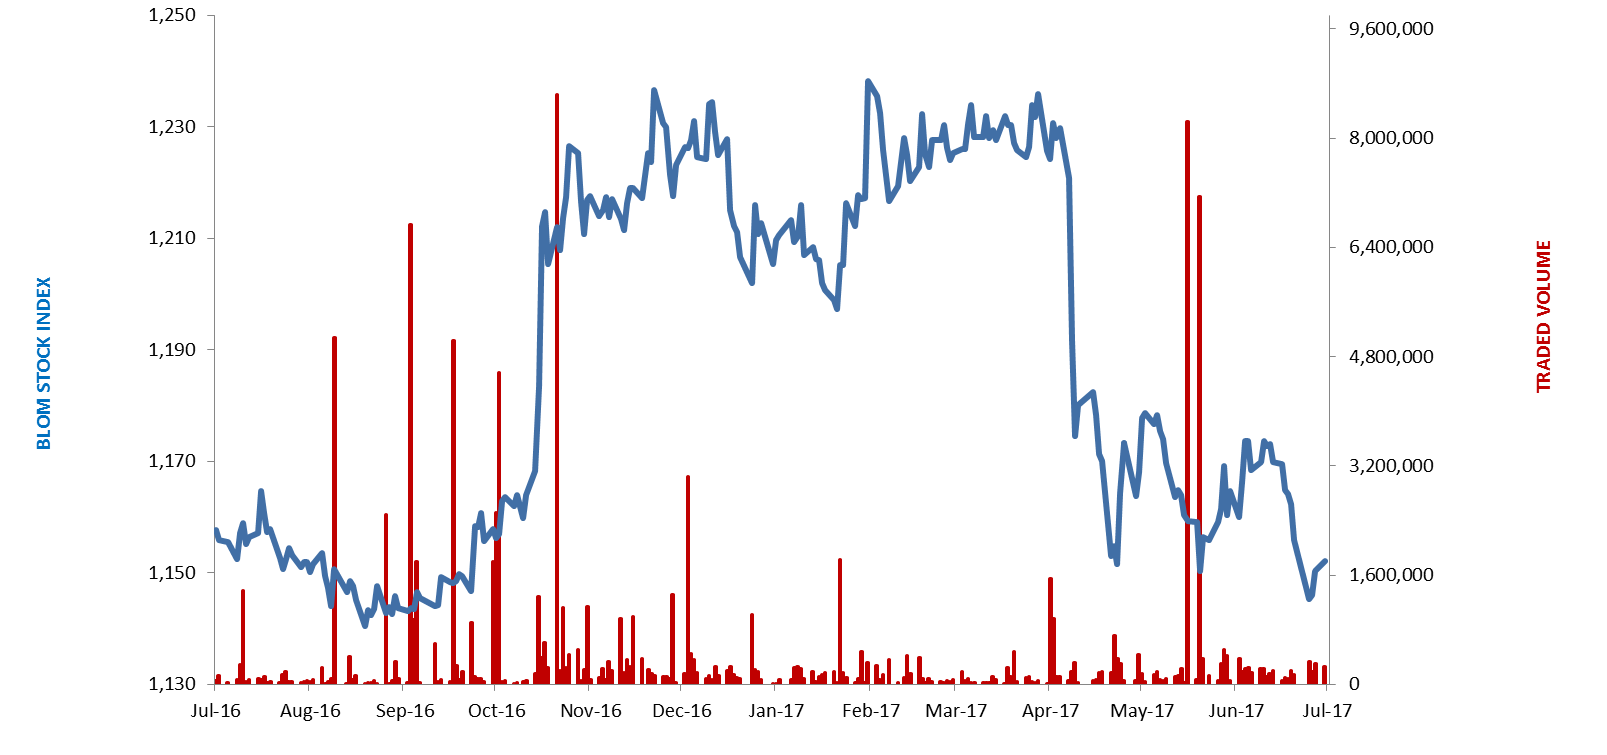
| BSI |
1,152.10 |
1,150.35 |
0.15% |
-5.00% |
| High |
1,153.60 |
1,153.43 |
|
|
| Low |
1,147.81 |
1,144.99 |
|
|
| Volume |
267,336 |
299,657 |
-10.79% |
|
| Val ($) |
5,054,163 |
2,729,673 |
85.16% |
|
BLOM Preferred Shares Index (BPSI): Today’s Performance
| |
Last |
Previous |
Change |
| BPSI |
104.68 |
104.69 |
-0.01% |
| Volume |
9,168 |
2,720 |
|
| Value |
561,001 |
272,360 |
|
Lebanese Stocks: Today’s Trades and Closing Prices
|
Last Price ($) |
% Change |
Volume |
VWAP ($) |
| Solidere A |
7.99 |
3.23% |
12,279 |
7.91 |
| Solidere B |
7.71 |
-1.53% |
2,104 |
7.71 |
| Bank Audi GDR |
6.20 |
0.49% |
4,395 |
6.20 |
| Bank Audi Preferred G |
100.10 |
-0.10% |
408 |
100.10 |
| Bank Audi Preferred H |
100.50 |
0.00% |
1,060 |
100.50 |
| Bank Audi Preferred I |
101.00 |
0.00% |
2,800 |
101.00 |
| Bank of Beirut Listed |
18.80 |
0.00% |
225,000 |
18.80 |
| Bank of Beirut Pref H |
25.15 |
0.00% |
4,800 |
25.15 |
| Byblos Bank Listed |
1.63 |
-1.81% |
5,000 |
1.63 |
| Byblos Bank Pref 2008 |
101.10 |
0.00% |
100 |
101.10 |
| BLOM Bank Listed |
11.20 |
0.00% |
90 |
11.20 |
| BLOM Bank GDR |
12.20 |
1.24% |
9,300 |
12.20 |
The BLOM Stock Index
Lebanese Global Depository Receipts: Last session’s Performance
| GDRs |
Last Price ($) |
Previous Price ($) |
% Change |
Volume |
Value ($) |
| BLOM GDR |
12.1 |
12 |
0.8% |
25,310 |
306,251 |
| Audi GDR |
6.01 |
6.16 |
-2.4% |
9,280 |
55,773 |
| Byblos GDR |
80 |
80 |
0.0% |
– |
– |
Source: Reuters
Closing Date: 30 June 2017
BLOM BOND INDEX: Last Session’s Performance
| |
Last |
Previous |
Change |
Y-t-D Change |
| BBI |
104.88 |
104.96 |
-0.08% |
|
2.92% |
| Weighted Yield |
6.147% |
6.119% |
2.81 |
bps |
|
| Duration (Years) |
5.26 |
5.26 |
|
|
|
| 5Y Bond Yield |
5.98% |
6.00% |
-2 |
bps |
|
| 5Y Spread* |
409 |
415 |
-6 |
bps |
|
| 10Y Bond Yield |
6.75% |
6.72% |
3 |
bps |
|
| 10Y Spread* |
444 |
445 |
-1 |
bps |
|
*between Lebanese Eurobonds and US Treasuries
Closing Date: 30 June 2017
Lebanese Eurobonds: Last Sessions’ Prices and Yields
| |
Price |
Yield |
Yield Change |
| 12/06/2018 |
100.38 |
4.73% |
0 |
| 12/11/2018 |
100.38 |
4.85% |
9 |
| 23/04/2019 |
100.50 |
5.20% |
8 |
| 20/05/2019 |
101.38 |
5.22% |
7 |
| 28/11/2019 |
100.13 |
5.39% |
11 |
| 09/03/2020 |
101.88 |
5.61% |
5 |
| 14/04/2020 |
100.38 |
5.65% |
5 |
| 19/06/2020 |
101.25 |
5.69% |
5 |
| 12/04/2021 |
107.88 |
5.89% |
0 |
| 04/10/2022 |
100.25 |
6.04% |
0 |
| 27/01/2023 |
99.63 |
6.08% |
-5 |
| 22/04/2024 |
101.50 |
6.37% |
2 |
| 04/11/2024 |
99.13 |
6.40% |
2 |
| 03/12/2024 |
103.38 |
6.42% |
4 |
| 26/02/2025 |
98.63 |
6.43% |
2 |
| 12/06/2025 |
98.75 |
6.45% |
2 |
| 28/11/2026 |
100.13 |
6.58% |
2 |
| 23/03/2027 |
100.75 |
6.74% |
4 |
| 29/11/2027 |
99.88 |
6.77% |
2 |
| 03/11/2028 |
98.63 |
6.82% |
0 |
| 26/02/2030 |
98.50 |
6.83% |
0 |
| 22/04/2031 |
100.75 |
6.91% |
1 |
| 23/03/2032 |
100.25 |
6.97% |
0 |
| 02/11/2035 |
99.75 |
7.07% |
0 |
| 23/03/2037 |
100.50 |
7.20% |
0 |
| |
Last Price |
Previous |
% Change |
Y-t-D |
| $/LBP |
1,514.00 |
1,514.00 |
– |
|
| €/LBP |
1,713.58 |
1,722.02 |
-0.49% |
|
| £/LBP |
1,954.47 |
1,963.52 |
-0.46% |
|
| NEER |
113.81 |
113.58 |
0.21% |
-3.88% |
Closing Date: 03 July 2017