Discover today’s performance of BLOM indices, the closing prices of Lebanese stocks and Eurobonds, as well as the exchange rate of major currencies against the LBP.
BLOM Stock Index (BSI): Today’s Performance
| |
Last |
Previous |
% Change |
Y-t-D Change |
| BSI |
1,148.37 |
1,151.67 |
-0.29% |
-5.31% |
| High |
1,151.67 |
1,154.54 |
|
|
| Low |
1,144.49 |
1,151.67 |
|
|
| Volume |
84,041 |
215,247 |
-60.96% |
|
| Val ($) |
1,735,739 |
1,965,613 |
-11.69% |
|
BLOM Preferred Shares Index (BPSI): Today’s Performance
| |
Last |
Previous |
Change |
| BPSI |
104.78 |
104.75 |
0.03% |
| Volume |
11,336 |
22,650 |
|
| Value |
1,146,080 |
571,913 |
|
Lebanese Stocks: Today’s Trades and Closing Prices
| |
Last Price ($) |
% Change |
Volume |
VWAP ($) |
| Solidere A |
8.01 |
2.82% |
53,204 |
7.86 |
| Solidere B |
7.92 |
-0.50% |
11,829 |
7.82 |
| Bank Audi GDR |
6.1 |
0.00% |
2,000 |
6.1 |
| Bank Audi Pref I |
101.1 |
0.09% |
11,236 |
101.1 |
| Byblos Bank Listed |
1.61 |
0.00% |
34 |
1.61 |
| Byblos Bank Pref 2009 |
101.2 |
0.09% |
100 |
101.2 |
| BLOM Bank Listed |
11.25 |
-0.44% |
1,000 |
11.25 |
| HOLCIM |
11.95 |
-14.70% |
4,638 |
11.95 |
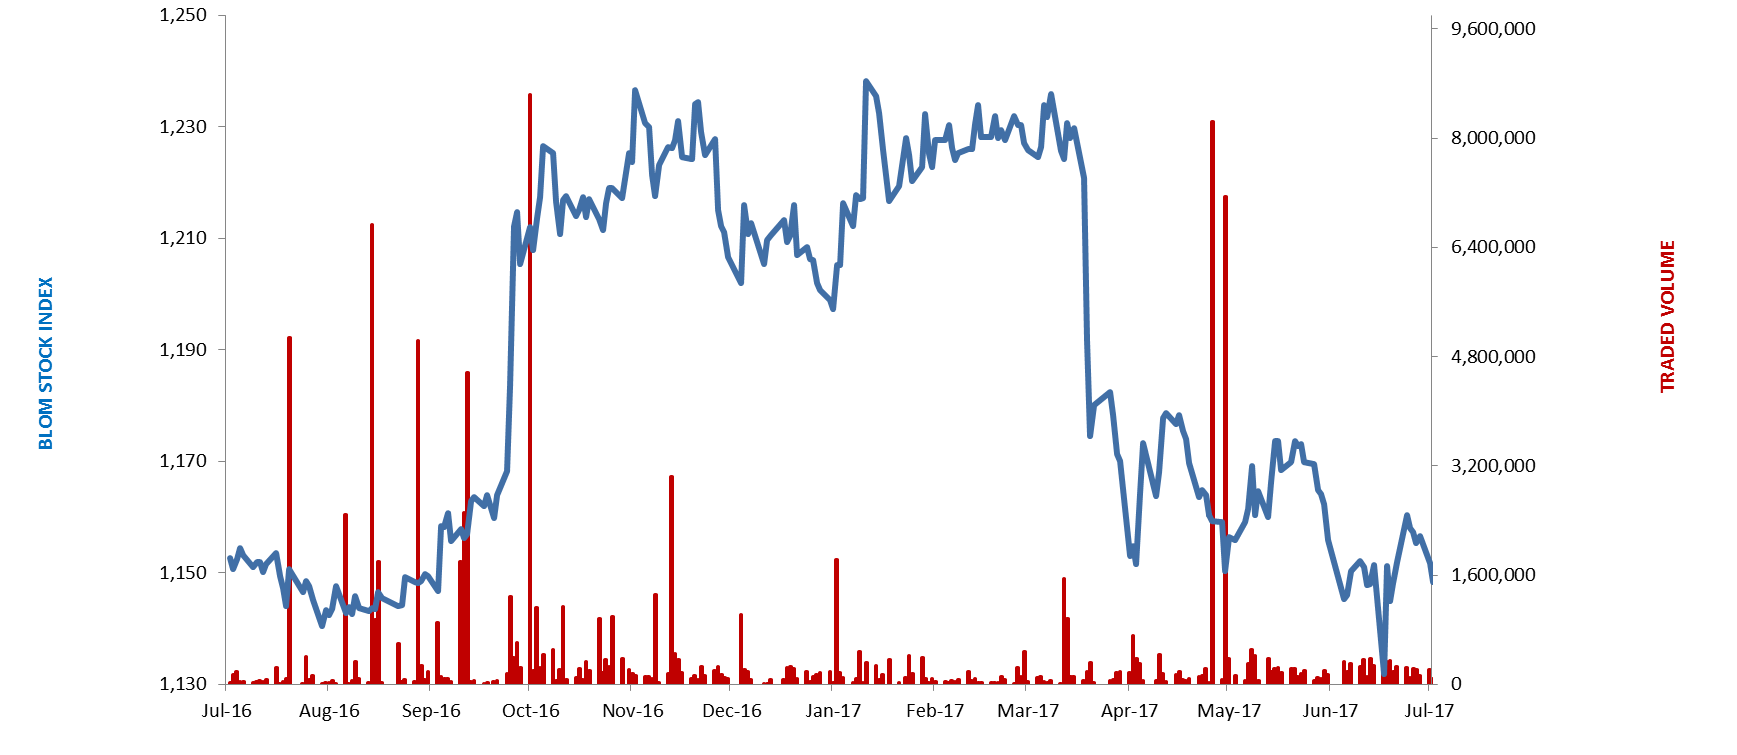
The BLOM Stock Index
Lebanese Global Depository Receipts: Last session’s Performance
| GDRs |
Last Price ($) |
Previous Price ($) |
% Change |
Volume |
Value ($) |
| BLOM GDR |
12.25 |
12.15 |
0.8% |
21,999 |
269,289 |
| Audi GDR |
6.03 |
6.18 |
-2.4% |
18,012 |
108,742 |
| Byblos GDR |
80 |
80 |
0.0% |
– |
– |
Source: London Stock Exchange
Closing Date: 24 July 2017
BLOM BOND INDEX: Last Session’s Performance
| |
Last |
Previous |
Change |
Y-t-D Change |
| BBI |
104.46 |
104.45 |
0.01% |
|
2.51% |
| Weighted Yield |
6.231% |
6.235% |
0 |
bps |
|
| Duration (Years) |
5.19 |
5.19 |
|
|
|
| 5Y Bond Yield |
6.18% |
6.18% |
0 |
bps |
|
| 5Y Spread* |
435 |
437 |
-2 |
bps |
|
| 10Y Bond Yield |
6.78% |
6.78% |
0 |
bps |
|
| 10Y Spread* |
452 |
454 |
-2 |
bps |
|
*between Lebanese Eurobonds and US Treasuries
Closing Date: 24 July 2017
Lebanese Eurobonds: Last Sessions’ Prices and Yields
| |
Price |
Yield |
Yield Change |
| 12/06/2018 |
100.38 |
4.70% |
0 |
| 12/11/2018 |
100.38 |
4.84% |
0 |
| 23/04/2019 |
100.15 |
5.40% |
-6 |
| 20/05/2019 |
101.00 |
5.41% |
-7 |
| 28/11/2019 |
99.75 |
5.56% |
0 |
| 09/03/2020 |
101.75 |
5.64% |
0 |
| 14/04/2020 |
100.25 |
5.70% |
0 |
| 19/06/2020 |
101.00 |
5.77% |
0 |
| 12/04/2021 |
107.38 |
6.00% |
0 |
| 04/10/2022 |
99.50 |
6.21% |
0 |
| 27/01/2023 |
98.75 |
6.27% |
0 |
| 22/04/2024 |
100.88 |
6.48% |
0 |
| 04/11/2024 |
98.63 |
6.49% |
0 |
| 03/12/2024 |
102.88 |
6.50% |
1 |
| 26/02/2025 |
98.15 |
6.51% |
0 |
| 12/06/2025 |
98.15 |
6.55% |
0 |
| 28/11/2026 |
99.75 |
6.63% |
0 |
| 23/03/2027 |
100.63 |
6.76% |
0 |
| 29/11/2027 |
99.63 |
6.80% |
0 |
| 03/11/2028 |
98.38 |
6.86% |
0 |
| 26/02/2030 |
98.00 |
6.89% |
0 |
| 22/04/2031 |
100.25 |
6.97% |
0 |
| 23/03/2032 |
100.00 |
7.00% |
0 |
| 02/11/2035 |
98.88 |
7.16% |
0 |
| 23/03/2037 |
100.13 |
7.24% |
-1 |
| |
Last Price |
Previous |
% Change |
Y-t-D |
| $/LBP |
1,513.75 |
1,513.75 |
– |
|
| €/LBP |
1,760.16 |
1,754.43 |
0.33% |
|
| £/LBP |
1,970.45 |
1,963.67 |
0.35% |
|
| NEER |
112.36 |
112.52 |
-0.14% |
-5.11% |
Closing Date: 25 July 2017