Discover today’s performance of BLOM indices, the closing prices of Lebanese stocks and Eurobonds, as well as the exchange rate of major currencies against the LBP.
BLOM Stock Index (BSI): Today’s Performance
| |
Last |
Previous |
% Change |
Y-t-D Change |
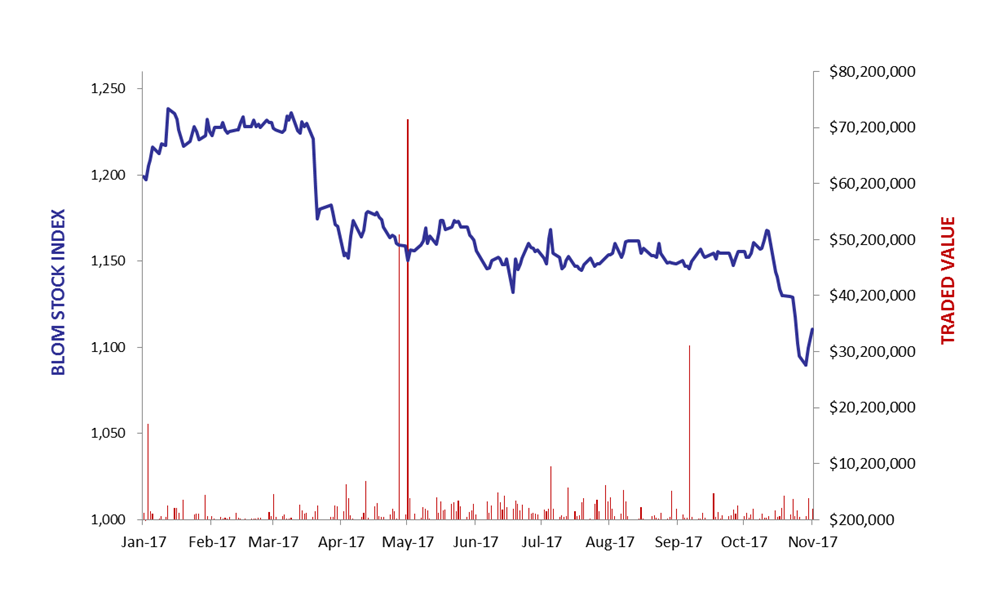
| BSI |
1,110.63 |
1,099.63 |
1.00% |
-8.42% |
| High |
1,110.80 |
1,101.63 |
|
|
| Low |
1,098.54 |
1,085.82 |
|
|
| Volume |
242,726 |
605,084 |
-59.89% |
|
| Val ($) |
2,120,221 |
3,998,102 |
-46.97% |
|
BLOM preferred Shares Index (BPSI): Today’s Performance
| |
Last |
Previous |
Change |
| BPSI |
105.18 |
105.18 |
0.00% |
| Volume |
1,000 |
2,111 |
|
| Value |
100,200 |
214,604 |
|
Lebanese Stocks: Today’s Trades and Closing Prices
| |
Last Price ($) |
% Change |
Volume |
VWAP ($) |
| Solidere A |
8.1 |
5.19% |
137,564 |
8.38 |
| Solidere B |
8.18 |
7.21% |
1,192 |
8.18 |
| Bank Audi |
5.5 |
0.00% |
16,000 |
5.5 |
| Bank Audi Pref I |
100.2 |
0.00% |
1,000 |
100.2 |
| Byblos Bank – Listed |
1.6 |
0.63 |
20,000 |
1.6 |
| BLOM – Listed |
10.9 |
0.46% |
19,400 |
10.9 |
| BLOM GDR |
11.08 |
1.09% |
47,500 |
11.06 |
| HOLCIM |
15 |
0.07 |
70 |
15 |
The BLOM Stock Index
Lebanese Global Depository Receipts: Last session’s Performance
| GDRs |
Last Price ($) |
Previous Price ($) |
% Change |
Volume |
Value ($) |
| BLOM GDR |
11 |
10.85 |
1.4% |
1,756 |
19,316 |
| Audi GDR |
5.5 |
5.3 |
3.8% |
70,930 |
390,035 |
| Byblos GDR |
77 |
77 |
0.0% |
– |
– |
Source: London Stock Exchange
Closing Date: 21 November 2017
BLOM BOND INDEX: Last Session’s Performance
| |
Last |
Previous |
Change |
Y-t-D Change |
| BBI |
98.49 |
97.13 |
1.39% |
|
-3.35% |
| Weighted Yield |
7.66% |
8.00% |
-34 |
bps |
|
| Duration (Years) |
5.05 |
5.03 |
|
|
|
| 5Y Bond Yield |
7.63% |
7.92% |
-29 |
bps |
|
| 5Y Spread* |
558 |
583 |
-25 |
bps |
|
| 10Y Bond Yield |
7.80% |
8.09% |
-29 |
bps |
|
| 10Y Spread* |
548 |
572 |
-24 |
bps |
|
*between Lebanese Eurobonds and US Treasuries
Closing Date: 21 November 2017
Lebanese Eurobonds: Last Sessions’ Prices and Yields
| |
Price |
Yield |
Yield Change |
| 12/11/2018 |
98.25 |
7.04% |
-82 |
| 23/04/2019 |
97.63 |
7.28% |
-38 |
| 20/05/2019 |
98.13 |
7.34% |
-46 |
| 28/11/2019 |
96.38 |
7.41% |
-35 |
| 09/03/2020 |
97.50 |
7.57% |
-49 |
| 14/04/2020 |
96.13 |
7.59% |
-48 |
| 19/06/2020 |
96.63 |
7.61% |
-50 |
| 12/04/2021 |
102.00 |
7.57% |
-38 |
| 04/10/2022 |
93.88 |
7.63% |
-26 |
| 27/01/2023 |
93.00 |
7.66% |
-28 |
| 22/04/2024 |
94.88 |
7.67% |
-45 |
| 04/11/2024 |
92.38 |
7.68% |
-33 |
| 03/12/2024 |
96.13 |
7.72% |
-32 |
| 26/02/2025 |
91.50 |
7.75% |
-27 |
| 12/06/2025 |
91.50 |
7.76% |
-26 |
| 28/11/2026 |
92.50 |
7.77% |
-27 |
| 23/03/2027 |
93.75 |
7.80% |
-26 |
| 29/11/2027 |
92.75 |
7.81% |
-29 |
| 03/11/2028 |
91.50 |
7.82% |
-20 |
| 26/02/2030 |
90.50 |
7.87% |
-24 |
| 22/04/2031 |
92.63 |
7.90% |
-21 |
| 23/03/2032 |
92.25 |
7.91% |
-20 |
| 02/11/2035 |
91.75 |
7.92% |
-20 |
| 23/03/2037 |
92.50 |
8.02% |
-19 |
| |
Last Price |
Previous |
% Change |
Y-t-D |
| $/LBP |
1,514.25 |
1,514.00 |
0.02% |
|
| €/LBP |
1,785.63 |
1,781.87 |
0.21% |
|
| £/LBP |
2,007.39 |
2,008.59 |
-0.06% |
|
| NEER |
111.94 |
112.88 |
-0.83% |
-5.46% |
Closing Date: 23 November 2017