Discover today’s performance of BLOM indices, the closing prices of Lebanese stocks and Eurobonds, as well as the exchange rate of major currencies against the LBP.
BLOM Stock Index (BSI): Today’s Performance
| |
Last |
Previous |
% Change |
Y-t-D Change |
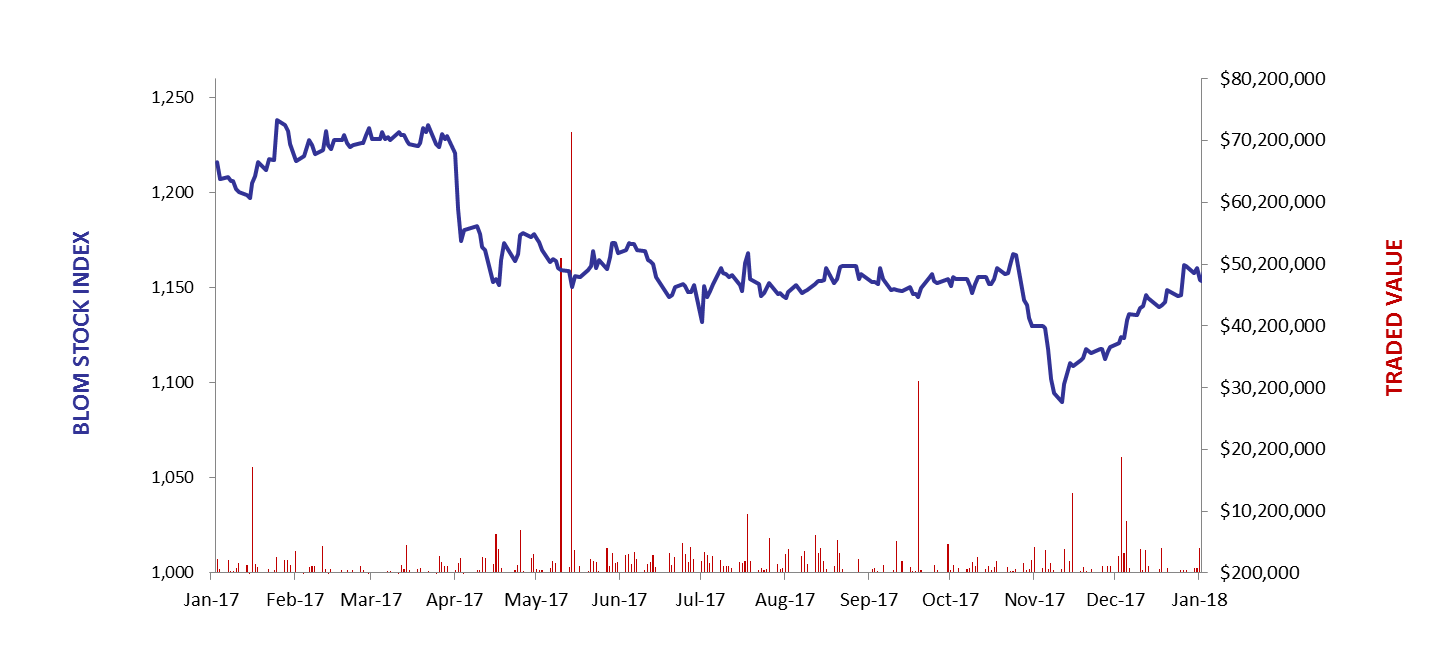
| BSI |
1,162.66 |
1,153.42 |
0.80% |
-4.13% |
| High |
1,162.66 |
1,154.32 |
|
|
| Low |
1,147.83 |
1,152.08 |
|
|
| Volume |
68,556 |
44,440 |
54.27% |
|
| Val ($) |
639,348 |
535,621 |
19.37% |
|
BLOM preferred Shares Index (BPSI): Today’s Performance
| |
Last |
Previous |
Change |
| BPSI |
107.70 |
107.70 |
0.00% |
| Volume |
2,670 |
4,574 |
|
| Value |
136,025 |
118,398 |
|
Lebanese Stocks: Today’s Trades and Closing Prices
| |
Last Price ($) |
% Change |
Volume |
VWAP ($) |
| Solidere A |
8 |
-0.37% |
40,164 |
8.11 |
| Solidere B |
8.11 |
1.25% |
17,831 |
7.86 |
| Bank Audi |
5.99 |
4.17% |
100 |
5.99 |
| Bank of Beirut Pref G |
100.3 |
0.00% |
900 |
100.3 |
| Bank of Beirut Pref J |
25.85 |
0.00% |
1,770 |
25.85 |
| Byblos Banl-Listed Shares |
1.59 |
-0.62% |
5,486 |
1.59 |
| BLOM-Listed Shares |
11.75 |
0.09% |
1,905 |
11.75 |
| HOLCIM |
14.25 |
-1.72% |
400 |
14.25 |
The BLOM Stock Index
Lebanese Global Depository Receipts: Last session’s Performance
| GDRs |
Last Price ($) |
Previous Price ($) |
% Change |
Volume |
Value ($) |
| BLOM GDR |
13 |
12.8 |
1.6% |
28,663 |
367,919 |
| Audi GDR |
5.9 |
5.9 |
0.0% |
2,100 |
12,390 |
| Byblos GDR |
76 |
76 |
0.0% |
– |
– |
Source: London Stock Exchange
Closing Date: 11 January 2018
BLOM BOND INDEX: Last Session’s Performance
| |
Last |
Previous |
Change |
Y-t-D Change |
| BBI |
102.79 |
102.64 |
0.14% |
|
0.87% |
| Weighted Yield |
6.50% |
6.53% |
-3 |
bps |
|
| Duration (Years) |
5.00 |
5.00 |
|
|
|
| 5Y Bond Yield |
6.20% |
6.30% |
-10 |
bps |
|
| 5Y Spread* |
388 |
398 |
-10 |
bps |
|
| 10Y Bond Yield |
7.02% |
7.03% |
-1 |
bps |
|
| 10Y Spread* |
448 |
448 |
0 |
bps |
|
*between Lebanese Euro bonds and US Treasuries
Closing Date: 11 January 2018
Lebanese Eurobonds: Last Sessions’ Prices and Yields
| |
Price |
Yield |
Yield Change |
| 12/11/2018 |
100.00 |
5.14% |
0 |
| 23/04/2019 |
100.25 |
5.29% |
0 |
| 20/05/2019 |
100.88 |
5.31% |
0 |
| 28/11/2019 |
100.00 |
5.45% |
0 |
| 09/03/2020 |
101.63 |
5.56% |
-6 |
| 14/04/2020 |
100.13 |
5.73% |
-6 |
| 19/06/2020 |
100.50 |
5.92% |
0 |
| 12/04/2021 |
106.25 |
6.10% |
0 |
| 04/10/2022 |
99.00 |
6.35% |
-12 |
| 27/01/2023 |
97.75 |
6.53% |
-6 |
| 22/04/2024 |
99.25 |
6.80% |
-5 |
| 04/11/2024 |
97.00 |
6.81% |
-7 |
| 03/12/2024 |
101.00 |
6.81% |
-7 |
| 26/02/2025 |
96.13 |
6.89% |
-2 |
| 12/06/2025 |
96.13 |
6.92% |
-2 |
| 28/11/2026 |
97.50 |
6.98% |
-4 |
| 23/03/2027 |
98.38 |
7.09% |
-2 |
| 29/11/2027 |
97.38 |
7.12% |
0 |
| 03/11/2028 |
96.13 |
7.17% |
-3 |
| 26/02/2030 |
94.50 |
7.34% |
-3 |
| 22/04/2031 |
96.50 |
7.42% |
0 |
| 23/03/2032 |
96.00 |
7.46% |
-1 |
| 02/11/2035 |
95.75 |
7.48% |
-1 |
| 23/03/2037 |
95.75 |
7.68% |
0 |
| |
Last Price |
Previous |
% Change |
Y-t-D |
| $/LBP |
1,513.50 |
1,514.25 |
-0.05% |
|
| €/LBP |
1,828.15 |
1,814.13 |
0.77% |
|
| £/LBP |
2,055.33 |
2,041.00 |
0.70% |
|
| NEER |
110.17 |
110.54 |
-0.33% |
-6.96% |
Closing Date: 12 January 2018