Discover today’s performance of BLOM indices, the closing prices of Lebanese stocks and Eurobonds, as well as the exchange rate of major currencies against the LBP.
BLOM Stock Index (BSI): Today’s Performance
| |
Last |
Previous |
% Change |
Y-t-D Change |
| BSI |
1,163.25 |
1,160.41 |
0.25% |
-4.08% |
| High |
1,164.32 |
1,165.25 |
|
|
| Low |
1,160.25 |
1,157.52 |
|
|
| Volume |
109,348 |
78,959 |
38.49% |
|
| Val ($) |
890,333 |
728,203 |
22.26% |
|
BLOM preferred Shares Index (BPSI): Today’s Performance
| |
Last |
Previous |
Change |
| BPSI |
106.36 |
106.36 |
0.00% |
| Volume |
1,100 |
5,859 |
|
| Value |
507,505 |
151,455 |
|
Lebanese Stocks: Today’s Trades and Closing Prices
| |
Last Price ($) |
% Change |
Volume |
VWAP ($) |
| Solidere A |
8.22 |
1.98% |
83,520 |
8.22 |
| Solidere B |
8.15 |
1.87% |
14,876 |
8.15 |
| Bank Audi GDR |
5.86 |
-1.51% |
2,200 |
5.86 |
| Bank Audi Pref J |
99.95 |
– |
300 |
99.95 |
| Bank of Beirut Pref H |
25.9 |
– |
800 |
25.9 |
| Byblos Bank |
1.62 |
0.62% |
6,667 |
1.62 |
| BLOM GDR |
12.9 |
0.78% |
985 |
12.9 |
| BLOM Listed |
12.39 |
2.39% |
11,000 |
12.39 |
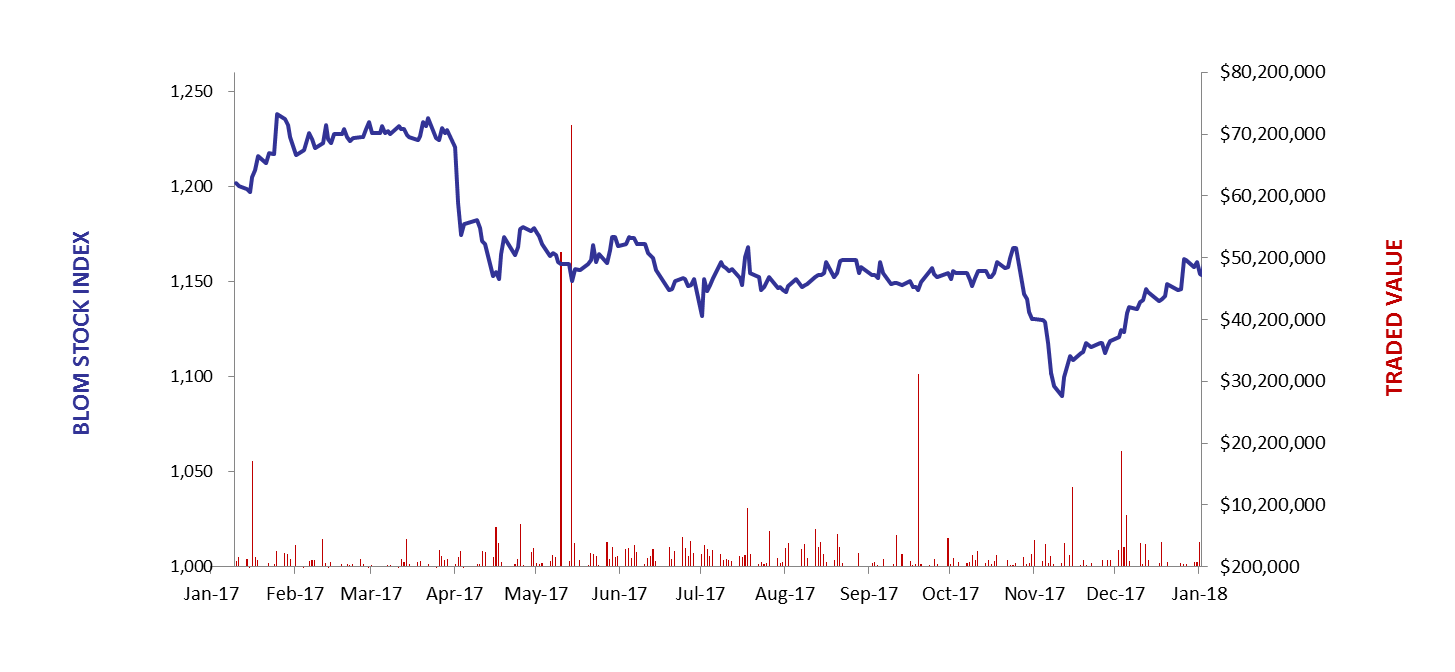
The BLOM Stock Index
Lebanese Global Depository Receipts: Last session’s Performance
| GDRs |
Last Price ($) |
Previous Price ($) |
% Change |
Volume |
Value ($) |
| BLOM GDR |
12.9 |
12.8 |
0.8% |
4,815 |
62,114 |
| Audi GDR |
5.9 |
5.9 |
0.0% |
4,230 |
24,957 |
| Byblos GDR |
76 |
76 |
0.0% |
– |
– |
Source: London Stock Exchange
Closing Date: 25 January 2018
BLOM BOND INDEX: Last Session’s Performance
| |
Last |
Previous |
Change |
Y-t-D Change |
| BBI |
103.14 |
103.06 |
0.07% |
|
2.06% |
| Weighted Yield |
6.50% |
6.51% |
-1 |
bps |
|
| Duration (Years) |
5.16 |
5.16 |
|
|
|
| 5Y Bond Yield |
6.05% |
6.05% |
0 |
bps |
|
| 5Y Spread* |
364 |
362 |
2 |
bps |
|
| 10Y Bond Yield |
6.96% |
7.02% |
-6 |
bps |
|
| 10Y Spread* |
433 |
437 |
-4 |
bps |
|
*between Lebanese Eurobonds and US Treasuries
Closing Date: 25 January 2018
Lebanese Eurobonds: Last Sessions’ Prices and Yields
| |
Price |
Yield |
Yield Change |
| 23/04/2019 |
100.13 |
5.38% |
0 |
| 20/05/2019 |
100.75 |
5.40% |
0 |
| 28/11/2019 |
99.88 |
5.51% |
0 |
| 09/03/2020 |
101.38 |
5.67% |
6 |
| 14/04/2020 |
100.13 |
5.73% |
0 |
| 19/06/2020 |
100.75 |
5.81% |
0 |
| 12/04/2021 |
106.75 |
5.91% |
0 |
| 04/10/2022 |
100.00 |
6.10% |
-6 |
| 27/01/2023 |
99.00 |
6.24% |
-3 |
| 22/04/2024 |
100.13 |
6.62% |
0 |
| 04/11/2024 |
97.75 |
6.67% |
0 |
| 03/12/2024 |
101.38 |
6.74% |
2 |
| 26/02/2025 |
96.50 |
6.83% |
0 |
| 12/06/2025 |
96.50 |
6.86% |
0 |
| 28/11/2026 |
97.88 |
6.92% |
-4 |
| 23/03/2027 |
98.88 |
7.02% |
-4 |
| 29/11/2027 |
97.75 |
7.07% |
-4 |
| 03/11/2028 |
96.25 |
7.15% |
-2 |
| 26/02/2030 |
94.50 |
7.34% |
0 |
| 22/04/2031 |
96.63 |
7.40% |
0 |
| 23/03/2032 |
96.13 |
7.45% |
0 |
| 02/11/2035 |
95.50 |
7.51% |
0 |
| 23/03/2037 |
96.50 |
7.60% |
-3 |
| |
Last Price |
Previous |
% Change |
Y-t-D |
| $/LBP |
1,514.25 |
1,514.25 |
– |
|
| €/LBP |
1,874.73 |
1,868.85 |
0.31% |
|
| £/LBP |
2,146.68 |
2,131.45 |
0.71% |
|
| NEER |
108.48 |
109.58 |
-1.00% |
-8.38% |
Closing Date: 26 January 2018